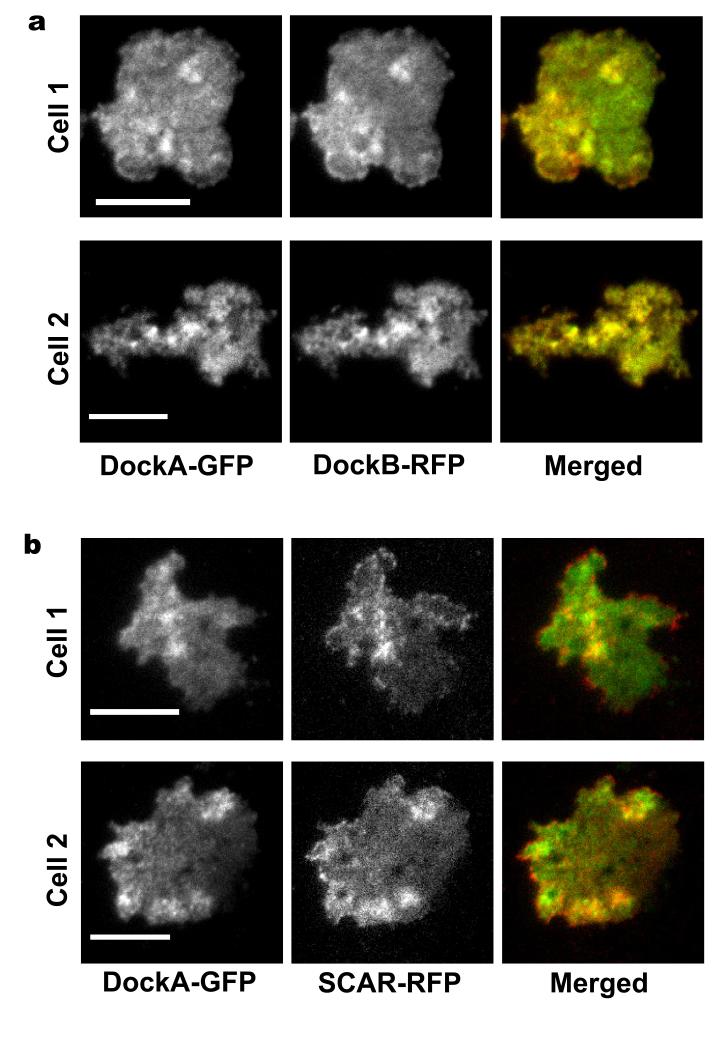
Figure 7. Co-localization data from dual-channel TIRF microscopy.
DockA-GFP was co-expressed with DockB-RFP (a) and with SCAR-RFP (b). Both fluorescence signals were simultaneously imaged using TIRF microscope with an image splitter at 2 fps. TIRF micrographs from both co-localisation studies show two different cells at the peak of the 1st phase of actin polymerisation. The GFP channel is shown on the left, the RFP channel in the middle and the merged channel on the right of each panel. Scale bars – 10 μm.

