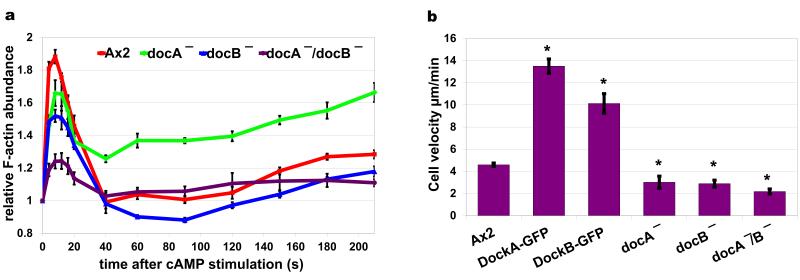
Figure 8. Phenotypes of deletion and over-expression of Dock proteins.
(a) cAMP dependent actin polymerisation response measured in wild type (Ax2) cells (red), docA KO cells (green), docB KO cells (blue) and docA/docB double KO cells (purple). Graph shows quantification of actin bands in the cytoskeletal fractions separated by SDS-PAGE and stained with fluorescent protein dye – Krypton. Plots represent means and standard errors of four separate experiments normalised to the pre-stimulation time point. (b) Velocity data of wild type strain (Ax2), strains over-expressing Dock proteins and knock-out mutants. Vegetative cells expressing LifeAct-RFP were imaged with confocal microscope during random walk for 20 minutes; their velocity was quantified using Quimp software. Bars represent average velocities and standard errors from at least 15 cells. The over-expressors showed statistically significant (t-Test) increased velocity (Ax2/DockA (p=5.4e−14), Ax2/DockB, (p=3.6e−7)) and the knock-outs were significantly slower (Ax2/docA− (p=1e−2), Ax2/docB− (p=1e−4), Ax2/docA−docB− (p=4.9e−7)) compared to wild type Ax2 cells.

