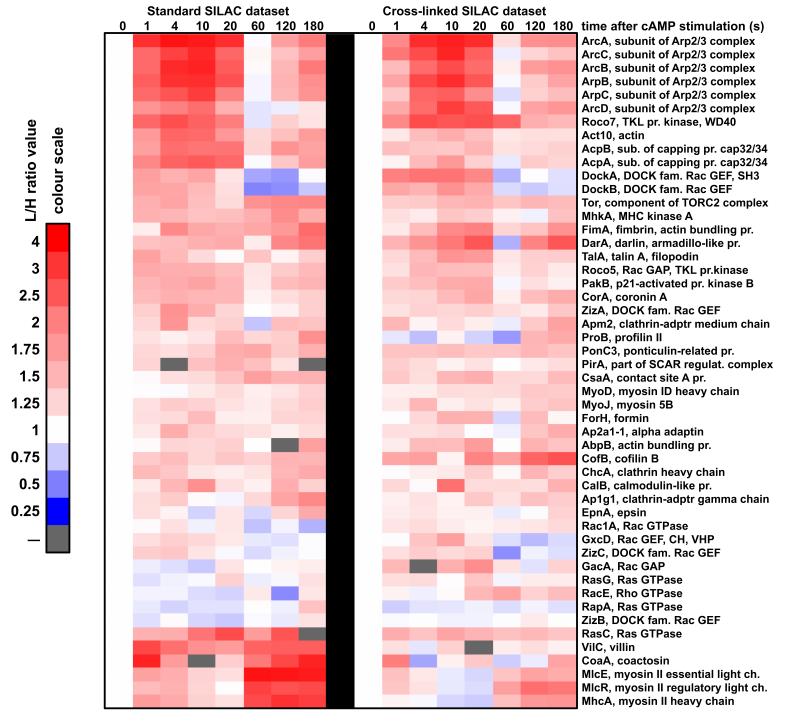
Figure 9. Comparison of the temporal incorporation profiles detected in the standard and cross-linked SILAC experiments.
Temporal enrichment profiles from the standard SILAC experiments (left) are paired with the profiles detected in the cross-linked SILAC experiment (right). Heat-maps represent cytoskeletal proteins that showed positive correlation (R>0.2) between the incorporation profiles detected in those two types of SILAC experiments. Columns represent time points after the cAMP stimulation. Red colour indicates increase of protein abundance and blue colour indicates depletion from the cytoskeletal fraction based on the L/H protein ratios normalised to the pre-stimulation value (heat-map colour scale illustrates quantitation). White represents a pre-stimulation level (t0=1) and grey indicates lack of data. Protein profiles were clustered with Cluster3 software and heat-maps were generated with Java TreeView software.

