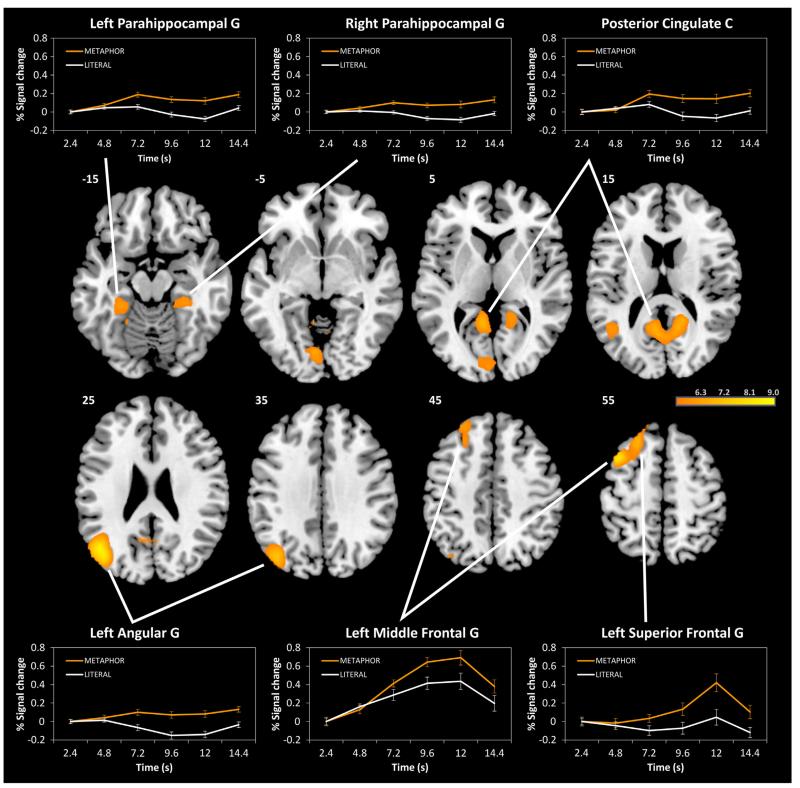
Fig. 2.
Whole brain analysis (T-maps) of the task contrast METAPHOR > LITERAL. Significant activation clusters (p < .05, FWE corrected, k > 20) are shown at different axial slices (z = −15, −5, 5, 15, 25, 35, 45, and 55). Additional, signal change is plotted over time (TR 1 to TR 6 after onset of idea generation period, corresponding to 2.4 to 14.4 s, respectively) for significant activation clusters. G = gyrus, C = cortex.

