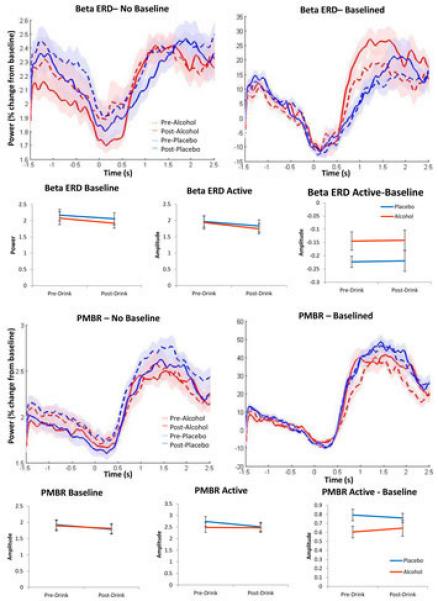
Figure 4.

Beta event related desynchronisation (beta ERD; top) and post-movement beta rebound (PMBR; bottom) data from the motor task. Time by amplitude plots indicate the mean time course of the amplitude of beta activity throughout a trial. Non-baselined plots indicate a discrepancy between conditions in the baseline pre-stimulus period. Plots of mean amplitude across the baseline and active periods and the difference between the two periods indicate no significant interactions between drug and time. Shaded areas and error bars indicate ± 1 within-subject standard error.
