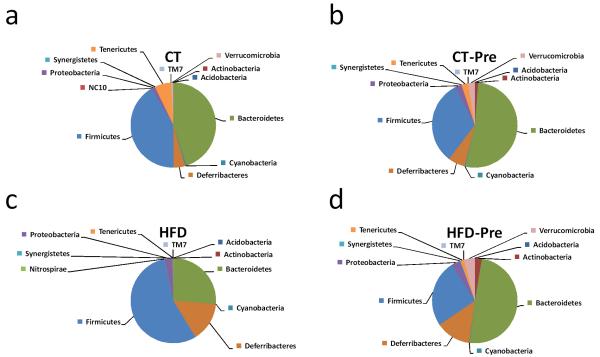
Figure 3. HFD feeding and prebiotic treatment affect the proportions of different phyla.
The composition of abundant bacterial phyla identified in the gut microbiota of control-diet-fed mice (CT) (n = 9), CT-diet-fed mice treated with prebiotics (CT-Pre) (n = 9), HFD-diet-fed mice (HFD) (n = 7) and HFD-diet-fed mice treated with prebiotics (HFD-Pre) (n = 10). Undetected phyla are not represented on the pie chart. The significant changes in specific phyla are shown in Supplementary Table S1.

