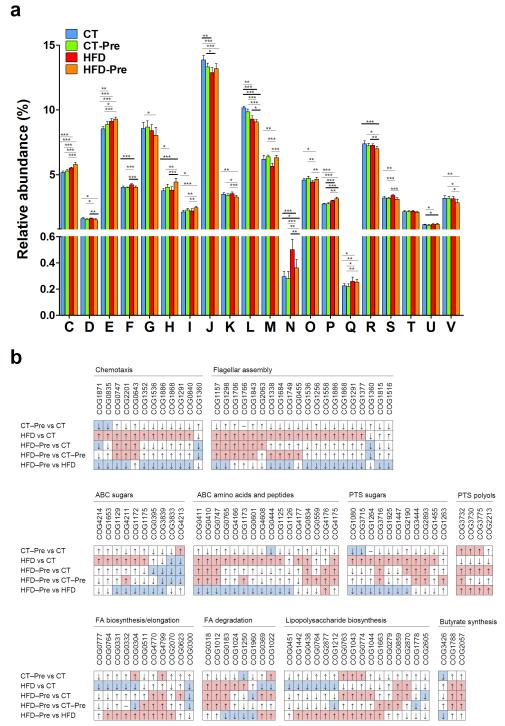
Figure 6. Orthologous groups of proteins (COGs) affected by the dietary treatments.
(a) Occurrence of identified orthologous groups of proteins (COGs) according to COG functional categories: A, A, RNA processing and modification are not shown on the figure since the abundance (%) was under 0.0025% in all four diet groups; C, Energy production and conversion; D, Cell cycle control, cell division, and chromosome partitioning; E, Amino acid transport and metabolism; F, Nucleotide transport and metabolism; G, Carbohydrate transport and metabolism; H, Coenzyme transport and metabolism, I Lipid transport and metabolism; J, Translation, ribosomal structure and biogenesis; K, Transcription; L, Replication, recombination and repair; M, Cell wall/membrane/envelope biogenesis; N, Cell motility; O, Posttranslational modification, protein turnover, chaperones; P, Inorganic ion transport and metabolism; Q, Secondary metabolites biosynthesis, transport and catabolism; R, General function prediction only; S, function unknown; T, Signal transduction mechanisms; U, Intracellular trafficking, secretion, and vesicular transport; V, defence mechanisms. Data are means ± s.e.m. * P<0.05, ** P<0.01, *** P<0.001 versus CT. (b) Changes in the occurrence of COGs according to the metabolic pathways affected following the different treatments. COGs with a median of ≥4 (~0.005% of the total number of COGs in normalised datasets) in at least one of the four diet groups were compared. Red and blue fields correspond to statistically significant increases and decreases in the COG relative abundances, respectively. The details of each COG number are shown in Supplementary Table S3.

