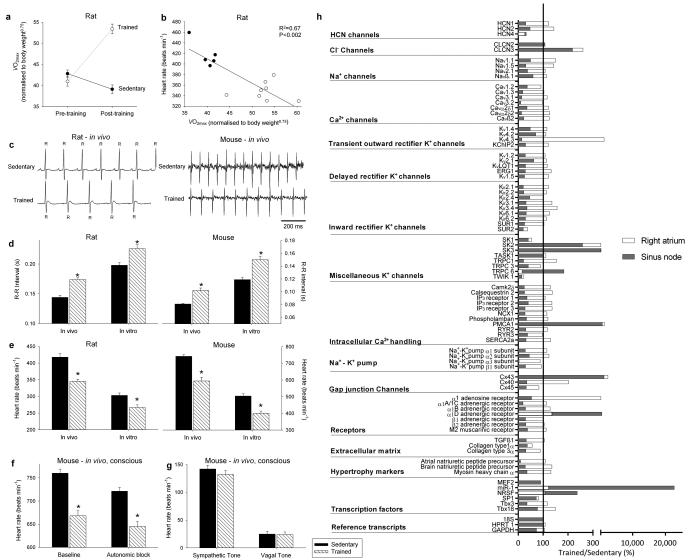
Figure 1. Exercise training induces sinus bradycardia and remodelling of the sinus node.
a, Increase in in the rat following the 12 week training period. Normalised of sedentary and trained rats before and after the 12 week training period shown (n=11/group). In all bar graphs: black bars, data from sedentary animals; hatched bars, data from trained animals. b, Significant correlation between heart rate in vitro and normalised in sedentary and trained rats (measured after 12 week training period). Each point corresponds to a different animal. Data fit with a straight line by linear regression (n=5/9; R2 and P values shown). c, Representative ECG traces obtained from sedentary and trained (unrestrained and conscious) rats and mice demonstrating longer R-R intervals in trained animals. d and e, Mean (+SEM) R-R intervals (d) and corresponding heart rates (e) measured in vivo (rats, n=5/9; mice, n=6/8) and in vitro (from isolated sinus node preparations; rats, n=5/9; mice, n=6/7) in sedentary and trained animals. f, Mean (+SEM) heart rate measured in vivo in conscious mice at baseline (n=9/11) and after complete autonomic block with propranolol and atropine (n=7/14). g, Mean (+SEM) sympathetic tone and vagal tone in conscious sedentary and trained mice (n=6/6). h, Expression of transcripts in the sinus node (grey bars) and atrial muscle (open bars) of trained rats as a percentage of that of sedentary rats. The vertical line corresponds to 100%, i.e. no change. Values below 100% correspond to a decrease on training and above 100% an increase. Student’s t test used to test differences between data from trained and sedentary animals. Normal distribution of data was tested using the Shapiro-Wilk W test and equal variance was tested using the F test. When the null hypothesis of normality and/or equal variance was rejected, the nonparametric Mann Whitney U test was used. *P<0.05.

