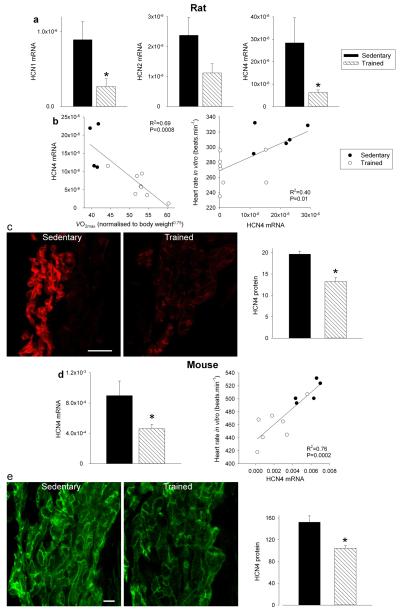
Figure 2. HCN channels in sinus node are downregulated by training.
a, Downregulation of mRNA for HCN channels in trained rats. Mean (+SEM) expression of mRNA for HCN1, HCN2 and HCN4 (normalised to expression of 18S) in the sinus node of sedentary and trained rats is shown (n=5/8; FDR-corrected Limma test). b, Significant correlations between HCN4 mRNA and normalised (left) and heart rate in vitro and HCN4 mRNA (right) in sedentary and trained rats. Each point corresponds to a different animal. In all scatter plots: filled circles, data from sedentary animals; open circles, data from trained animals. Data fit with straight lines by linear regression (n=4/8; R2 and P values shown). c, Downregulation of HCN4 protein in trained rats. Representative images of HCN4 immunolabelling (red signal) in the sinus node of sedentary and trained rats are shown in the left and middle panels, respectively (scale bar, 100 μm.). The right panel shows the mean (+SEM) HCN4 protein expression quantified using ImageJ from the National Institutes of Health (n=4). d, Downregulation of mRNA for HCN4 in trained mice. The left panel shows the mean (+SEM) expression of HCN4 mRNA (normalised to expression of 18S) in the sinus node of sedentary and trained mice (n=6/7) and the right panel shows a significant correlation between heart rate in vitro and HCN4 mRNA in sedentary and trained mice. Each point corresponds to a different animal. Data fit with a straight line by linear regression (n=5/7; R2 and P values shown). e, Downregulation of HCN4 protein in trained mice. Representative images of HCN4 immunolabelling (green signal) in the sinus node of sedentary and trained mice are shown in the left and middle panels, respectively (scale bar, 10 μm). The right panel shows mean (+SEM) HCN4 protein expression (n=4). Student’s t test used to test differences between data from sedentary and trained animals. Normal distribution of data was tested using the Shapiro-Wilk W test and equal variance was tested using the F test. When the null hypothesis of normality and/or equal variance was rejected, the nonparametric Mann Whitney U test was used. *P<0.05.

