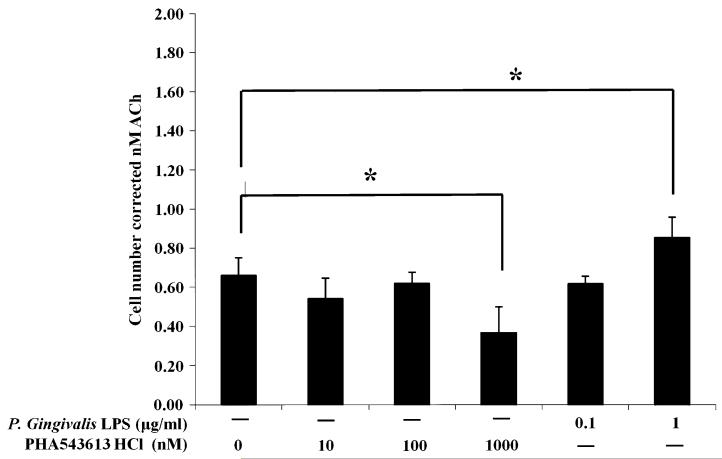
Fig. 3.
P. gingivalis LPS and PHA-543613 HCl modulate the release of ACh from OKF6/TERT-2 cells. The concentration of ACh in cell culture supernatants was determined using the GeneBLAzer M3 CHO-K1-bla cell reporter assay. The data represent the total concentration of ACh (with SD) in supernatants after a 10-min incubation period with a correction for cell number. The data are derived from duplicate wells of 3 independent experiments (n = 3). The data were standardised and statistical analysis performed by ANOVA and a post hoc Holm–Bonferroni (H–B) corrected least significant difference test (*P < 0.05/H–B)

