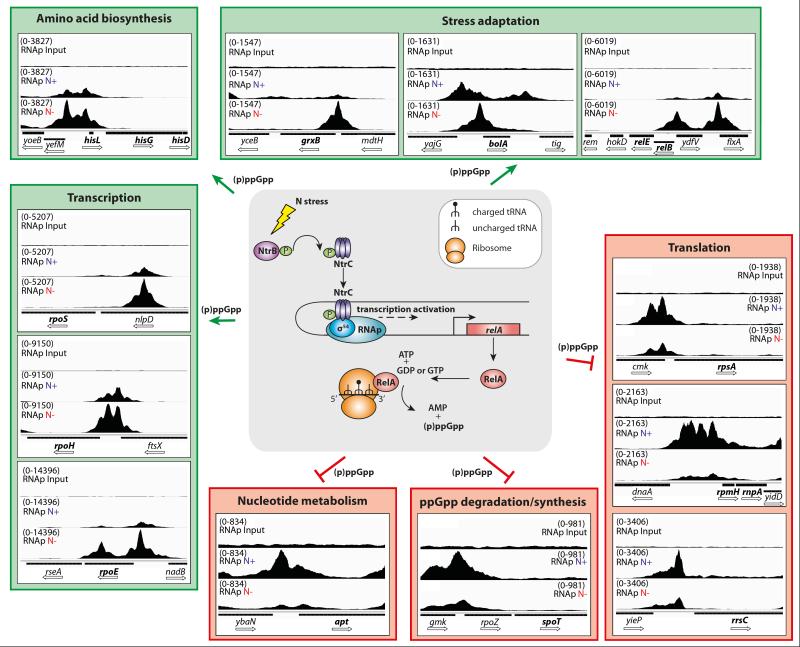
Figure 3. NtrC couples the Ntr stress response and stringent response in N starved E. coli.
The cartoon in the middle of the figure represents the model by which N starvation is sensed and leads to the NtrC mediated activation of transcription of relA, which subsequently leads to the production of ppGpp. Around this cartoon, we show screenshots of Integrative Genome Viewer32 with tracks showing the binding profiles (tag density) as measured by ChIP-seq of RNAp binding in N non-starved (denoted as N+) and N starved (denoted as N−) E. coli aligned against the upstream regions of a representative set of known ppGpp responsive promoters grouped into key cellular processes. A track with the input DNA control tag density (denoted as input) is shown for comparison. The screenshots in the green and red boxes denote promoters at which RNAp binding is positively and negatively, respectively, affected by ppGpp.

