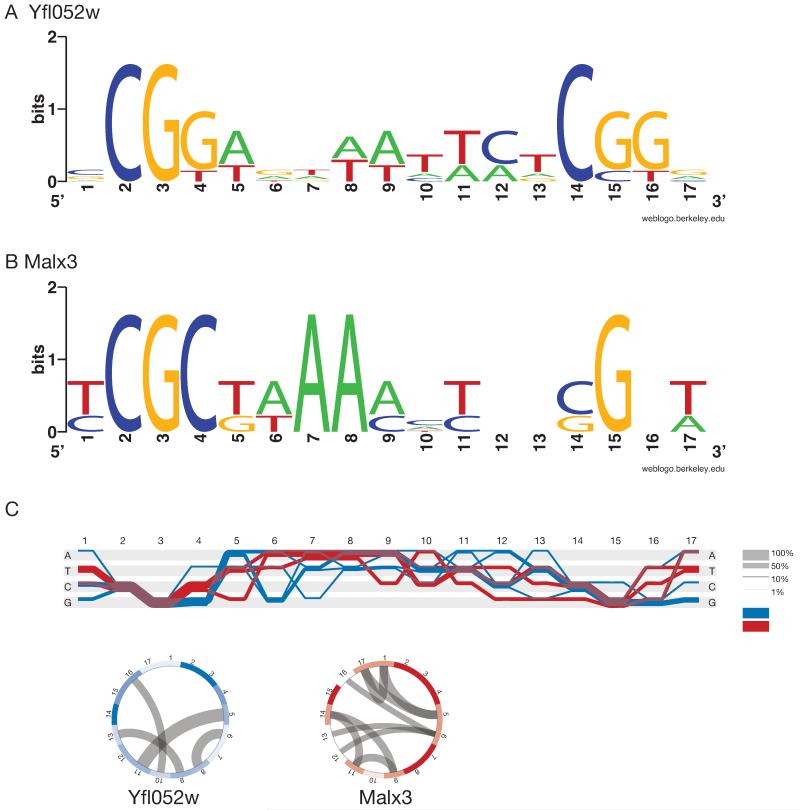
Figure 2. Different DNA-binding specificity of different MalR transcription factors.
(a) Sequence logo of Yfl052w DNA binding site CGG(9N)CGG. (b) Sequence logo of Malx3 DNA binding site CGC(9N)CGN. (c) Sequence Diversity Diagram conveying differences and similarities between Yfl052w (blue) and Malx3 (red) binding sites. Regions where two groups overlap are shown in purple. Thickness of the line shows the relative proportion of the aligned sequences. Positions that differentiate two groups are identified by a separation of blue and red lines. The rings below are basic heatmaps in circular layout showing the information content of the positions. The more saturated the color, the higher the information content, thus indicating conserved regions. Mutual information (MI) represents covariance of positions and is shown as grey lines inside the circles. High MI indicates the dependency of one position on another.

