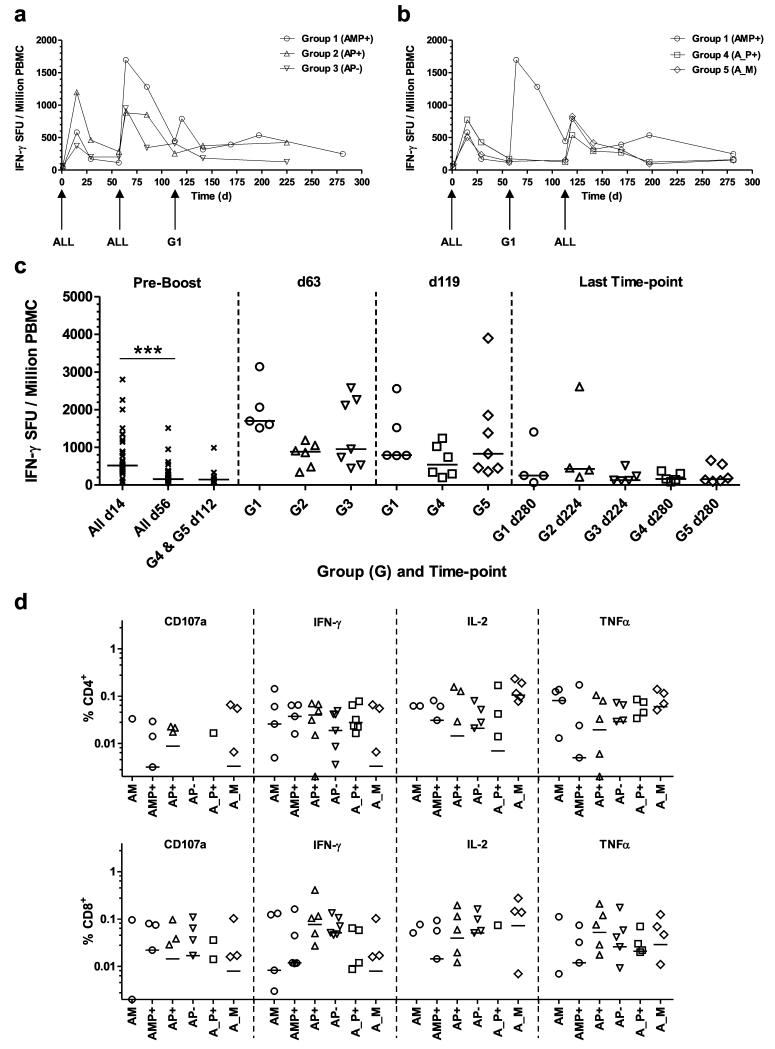
Figure 2. T cell responses of mixed-modality AMA1 immunization regimens.
T cell responses were assessed in each group by ex-vivo IFN-γ ELISPOT using fresh PBMC. All volunteers received the same prime with ChAd63 AMA1 on d0. Median responses are shown over time for the 3D7 AMA1 allele in (a) Groups 1, 2 and 3 which all received a booster immunization on day 56, and (b) Groups 1, 4 and 5 which all received a booster immunization on d112, (note Group 1 received a booster immunization at both of these time-points). (c) Median and individual IFN-γ ELISPOT responses are shown for key time-points: all volunteers combined before boosting at days 14 and 56 (n=31) and day 112 (n=13); one week after the booster immunizations (d63 and d119); and the final time-point of follow-up 24 weeks after the last immunization (d224 or d280). *** P<0.0001, Wilcoxon matched-pairs signed rank test. (d) Frozen PBMC from 4 weeks post-booster immunization = d84 (AM, AP+, AP−) and d140 (AMP+, A_P+ and A_M), were re-stimulated with a pool of 3D7 AMA1-specific peptides and assayed by ICS for all volunteers (except for one in Group 5 (A_M) for which cells were not available). Individual and group median responses are shown for the % CD4+ (top) and CD8+ (bottom) T cells positive for CD107a, IFN-γ, IL-2 or TNFα. Any values <0.002% are not shown.

