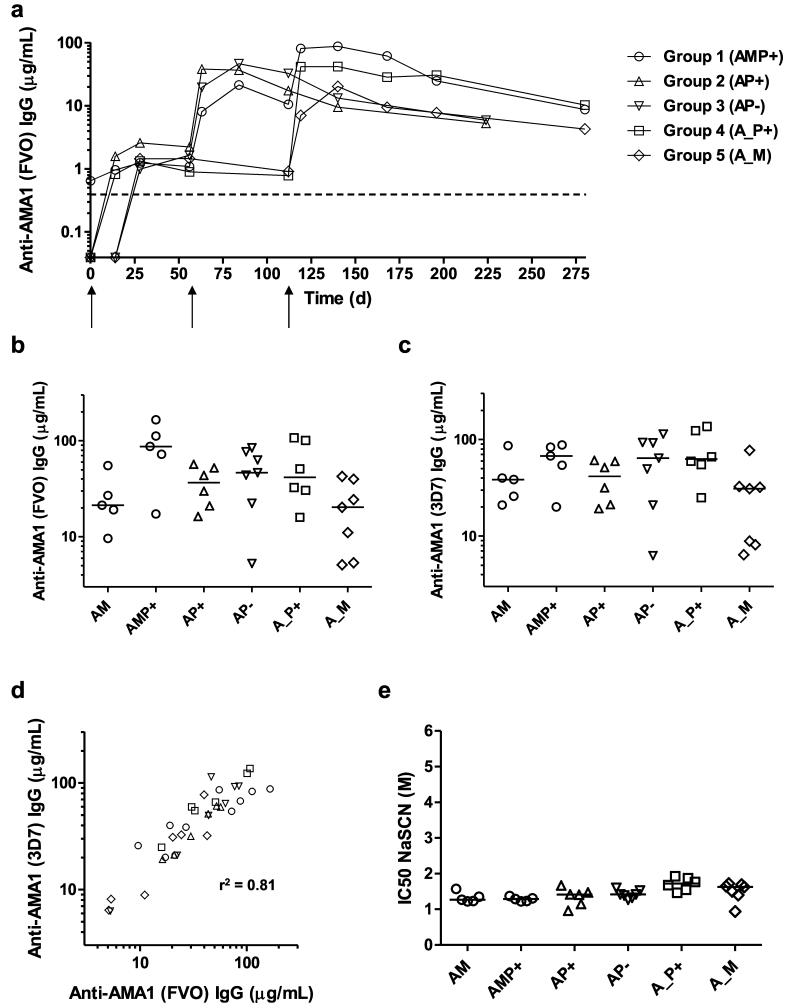
Figure 3. Humoral responses of mixed-modality AMA1 immunization regimens.
Serum IgG antibody responses were assessed in each group by anti-AMA1 ELISA. All volunteers received the same prime with ChAd63 AMA1 on d0. (a) Median responses are shown over time for all groups for the FVO AMA1 allele. The dashed line indicates the limit of detection in the assay. (b) Median and individual ELISA responses against FVO AMA1 are shown four weeks after all booster vaccinations: day 84 following AM, AP+ and AP− immunization, and day 140 following AMP+, A_P+ and A_M immunization. (c) The same as in b except the ELISA was performed for 3D7 AMA1. (d) Concordance between the anti-AMA1 total IgG ELISA readouts between the two allelic variants of AMA1 (responses as shown in b and c). Linear regression r2 value is shown; slope = 0.96 (95% C.I. = 0.79 – 1.13); Y-intercept = 8.9 μg/mL (95% C.I. = 0.23 – 17.6) (n=36). (e) Avidity of serum IgG responses was assessed by NaSCN-displacement 3D7 AMA1 ELISA and is reported as the molar (M) concentration of NaSCN required to reduce the starting OD in the ELISA by 50% (IC50). Median and individual responses are shown. Regimens and time-points as in b and c.

