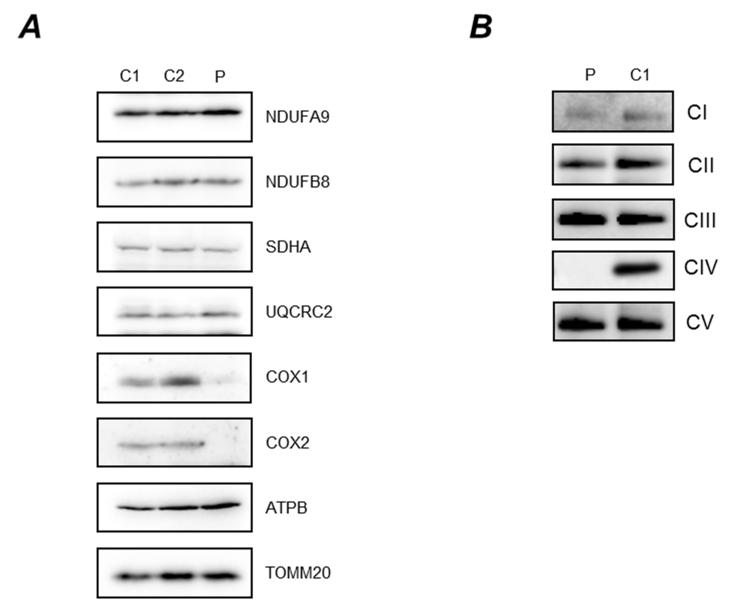
Figure 2. Steady state levels of OXPHOS components and complexes.
[A] Cell lysate from control (C1, C2) and patient (P) fibroblasts (40μg) were analysed by SDS PAGE (12%) and immunoblotting. Subunit-specific antibodies were used against CI (NDUFA9, NDUFB8), CII (SDHA), CIII (UQCRC2), CIV (COX1, COX2) and CV (ATPB). The outer mitochondrial membrane marker, TOM20, was used as a loading control. [B] Mitochondrial proteins (50μg) isolated from patient (P) and control (C1) fibroblasts were analysed by one dimensional BN-PAGE (4 to 16% gradient) using subunit-specific antibodies as indicated [CI (NDUFA9), CII (SDHA), CIII (UQCRC2), CIV (COX1) and CV (ATP5A)], to assess the assembly of individual OXPHOS complexes. Complex II (SDHA) was used as a loading control.

