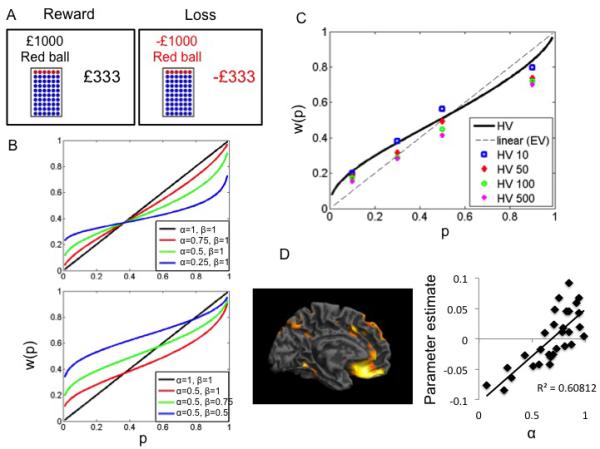
Figure 1.

A. Risk task. Subjects choose between a Gamble and Sure choice in both Reward and Loss conditions across 4 probabilities (0.1 0.3 0.5 0.9) and 4 expected values (£10 £50 £100 £500). A staircase procedure was used to estimate the gamble’s certainty equivalents (amount of sure payoff in subject indifferent between sure payoff and gamble). B. Examples of functions with different non-linear (α) and convexity (β) values. C. Probability weighting, w(p), data of healthy volunteers in reward condition as a function of objective probability, p. The dotted line represents certainty equivalence = expected value. D. Regression analysis of grey matter volume and α. The regression represents left ventromedial prefrontal cortex as a function of α.
