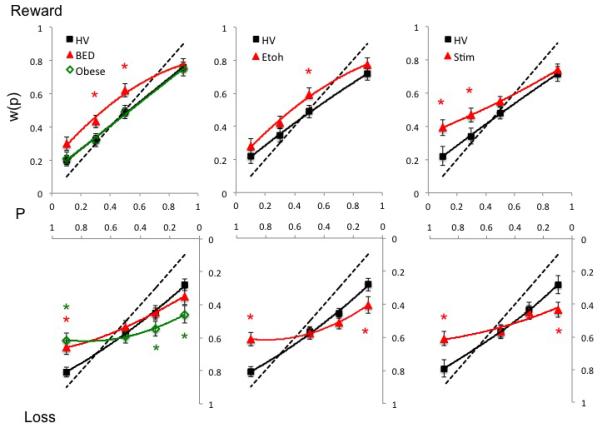
Figure 2.

Probability weighting in pathological disorders in reward and loss conditions. The graphs compare probability weighting, w(p), in Obese subjects with binge eating disorder (BED) and without BED (Obese controls), abstinent alcohol dependent (EtOH) and abstinent methamphetamine dependent (Meth) versus their own age- and gender-matched controls for reward (top) and loss (bottom) conditions. The dotted line represents certainty equivalence = expected value. Error bars represent standard error of the mean. *posthoc analysis results following interaction effect of Group × Valence × Probability. Details of significant differences are described in the text and Table S3. Abbreviations: P = probability.
