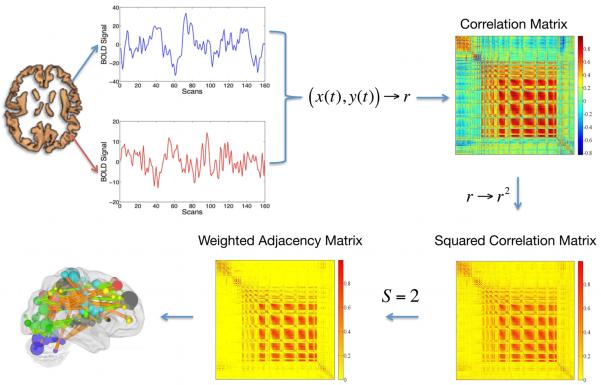
Figure 1. The pipeline used to calculate an eigenvector centrality map.
A correlation matrix calculated by considering ~ 40,000 grey matter (including brainstem and cerebellum) voxels’ timeseries was squared. The Erdos-Renyi entropy S=log(N)/log((Σdi)/N), i=1,…N (N being the number of nodes and di the degree of the ith node) of the network was set equal to 2 across subjects. As a result, a binary matrix whose entries were weighted by above threshold r2 values (weighted adjacency matrix) was obtained. The eigenvector belonging to the normalized largest eigenvalue of the weighted adjacency matrix was calculated and its entries provided a centrality measure for each voxel.

