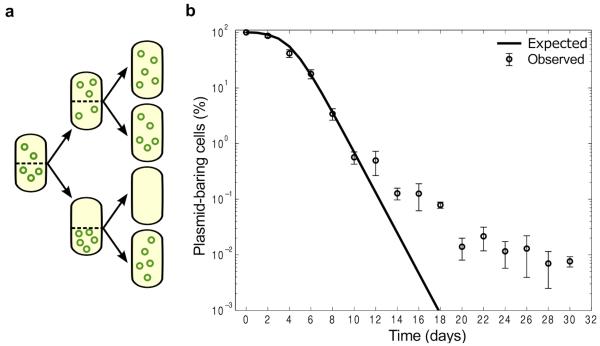
Figure 1. Stability of pNUK73 in the bacterial population.
(A) Diagram illustrating the probability of a daughter cell not receiving any plasmid during division assuming no active partitioning system and random division of the plasmids (B) Relative proportion of plasmid-bearing bacteria (logarithmic scale) as a function of time. Expected (solid line) and observed (circles, average ± s.d., n=3) dynamics of loss of plasmid pNUK73 in the population. Note how the numerical simulations of the model capture with quantitative accuracy the first ten days of the experiments, but predict very different dynamics than observed experimentally after ten days.

