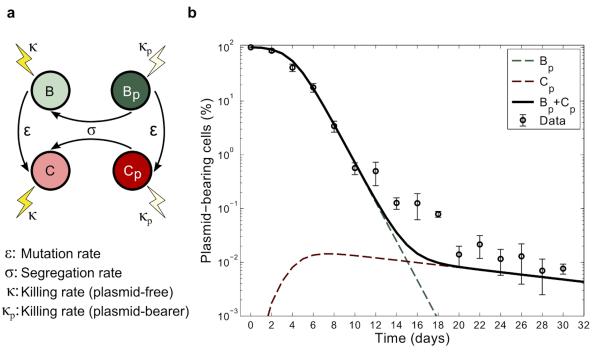
Figure 3. Compensatory adaptation stabilizes pNUK73 in the bacterial population.
(A) Diagram illustrating the evolutionary dynamics of the model described in supplement 2. (B) Relative proportion of plasmids-bearing bacteria (logarithmic scale) as a function of time. The solid black line represents the total expected frequency of plasmid bearers, while the red and green dotted lines denote the expected frequency of plasmid-bearing cells with and without the compensatory mutation. Circles represent the observed frequency of plasmid-bearing cells over time (average ± s.d., n=3). Note that the predicted stabilization at the end of the experiment is a consequence of the compensated plasmid-bearing population having a higher fitness than the original parental strain and matches the experimental results.

