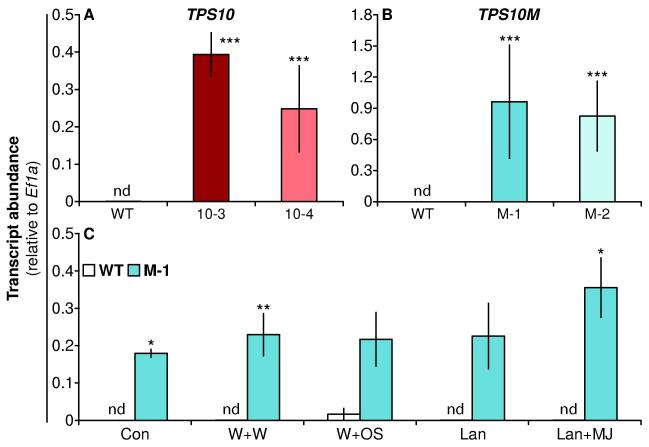
Figure 2. Transcript levels of TPS10 and TPS10M are high in transgenic lines and stable across several treatments (mean ± SEM, n = 4).
Transcripts were quantified in the first fully expanded leaf (+1) in two lines of TPS10 (A), in two lines of TPS10M (B), or in line M-1 1 h after treatment with herbivory-related elicitors (C), which did not change TPS10M transcript abundance (P = 0.491 in a Kruskal-Wallis test across treatments). Similarly, no effect of treatment was observed on transcripts in the other lines in separate experiments (not shown). There was a very low signal due to nonspecific amplification in WT negative controls (nd, < 0.001 units) which increased to a maximum of ca. 0.03 units after W+OS treatment. *P < 0.05, **P < 0.01, ***P < 0.001 after Holm-Bonferroni correction of Welch’s t-tests versus WT (WT tested twice in A and B, M-1 tested twice in C).

