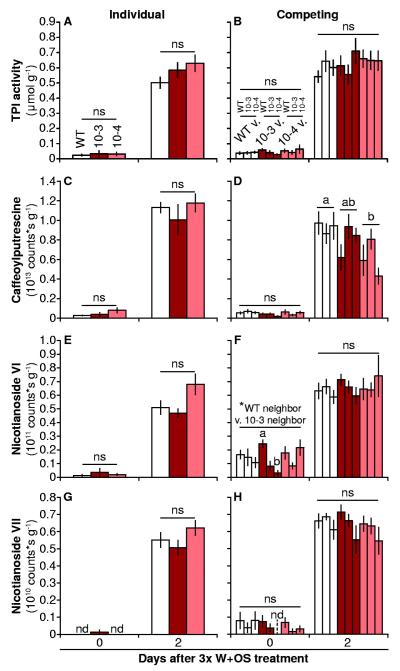
Figure 7. TPS10 plants and WT accumulate similar levels of defense metabolites after multiple elicitations, when grown alone or in competition with WT or TPS10 neighbors (mean ± SEM, n = 6).
Labels in A apply to left panels, while labels in B apply to right panels. Leaves were harvested from the same plants before (+1), and 48 h after the first of three elicitations with W+OS over 18 h across 2 d (+2), so that differences in metabolite accumulation due either to direct induction or priming of the induced response could be amplified and detected. Levels of several defense metabolites elicited by herbivory, including trypsin protease inhibitors (TPIs, A-B), caffeoylputrescine (C-D), and two malonylated hydroxygeranyllinalool diterpene glycosides (HGL-DTGs), nicotianoside VI (E-F) and VII (G-H), showed few or no differences among lines or in response to different neighbors. The Holm-Bonferroni method was used to correct for 2-3 tests of each data set (effect of line within individuals or competing pairs, effect of neighbor within competing pairs, effect of competition, and post-hoc pairwise tests); each ANOVA and its accompanying post-hoc tests were counted as single tests for P-value correction. a,bDifferent letters indicate significant differences (P < 0.05) after Holm-Bonferroni correction of Tukey’s HSD tests of genotype for caffeoylputrescine at 2 d; or of neighbor identity (WT neighbor or 10-3 neighbor) and of the interaction between line and neighbor identity (10-3 v. WT and 10-3 v. 10-4) for Nicotianoside VI at 0 d; ns, not significant.

