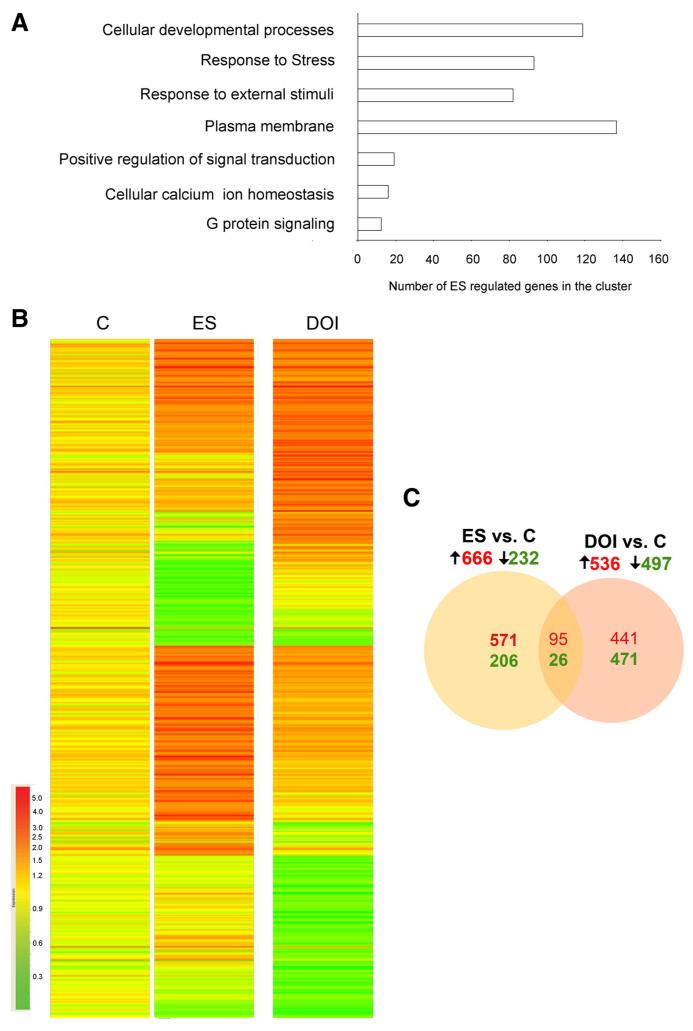
Figure 8. Exposure to early stress alters the adult prefrontal transcriptome.
A, Functional analysis of ES-regulated genes reveals enrichment of cellular development processes, stress-response pathways, transmembrane components, transduction of extracellular signal, G protein signaling, and ion homeostasis pathways in the PFC. B, Hierarchical cluster of significantly regulated genes ( p < 0.05, t test corrected for multiple comparisons; upregulated genes are shown in red, downregulated genes are shown in green) across the control (C) and ES groups (n = 3 control; n = 4 ES). Each row represents a single gene and each column represents the average fold change for each group. The data are log-transformed, normalized intensity values. C, The numbers of upregulated (red) and downregulated (green) genes in the ES and DOI groups (fold change cutoff: 1.5 for upregulated and 0.66 for downregulated genes, p < 0.05 compared with control; t test corrected for multiple comparisons) are represented using a Venn diagram. As represented in the Venn diagram, ~13% of the genes regulated by ES were similarly regulated in the DOI group.

