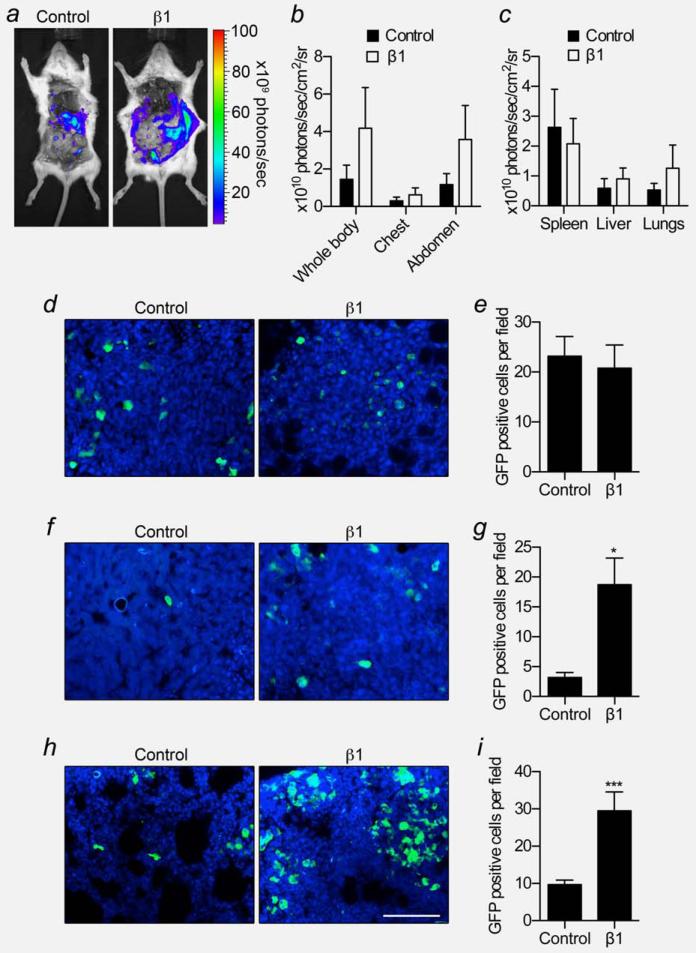
Figure 4. Effect of β1 over-expression on breast cancer metastasis in vivo.
At 5 weeks following implantation, control and β1 tumours were removed post mortem prior to bioluminescent imaging. (a) Representative bioluminescent images of metastases from control and β1 tumours. (β) Bioluminescence measured from the indicated anatomical sites from control and β1 tumour-bearing mice (n≥ 5). (c) Bioluminescence measured ex vivo from the spleen, liver, and lungs of control and β1 tumour-bearing mice (n ≥ 5). (d) Spleen sections from control and β1 tumour-bearing mice showing GFP signal (green) and DAPI (blue). (e) GFP-positive cells per field of view of spleen (n = 30). (f) Liver sections from control and β1 tumour-bearing mice showing GFP signal (green) and DAPI (blue). (γ) GFP-positive cells per field of view of liver (n = 30). (h) Lung sections from control and β1 tumour-bearing mice showing GFP signal and DAPI (blue). (i) GFP-positive cells per field of view of lung (n = 30). Bars are mean 1 SEM; *p < 0.05; ***p < 0.001. Scale bar, 100 μm.

