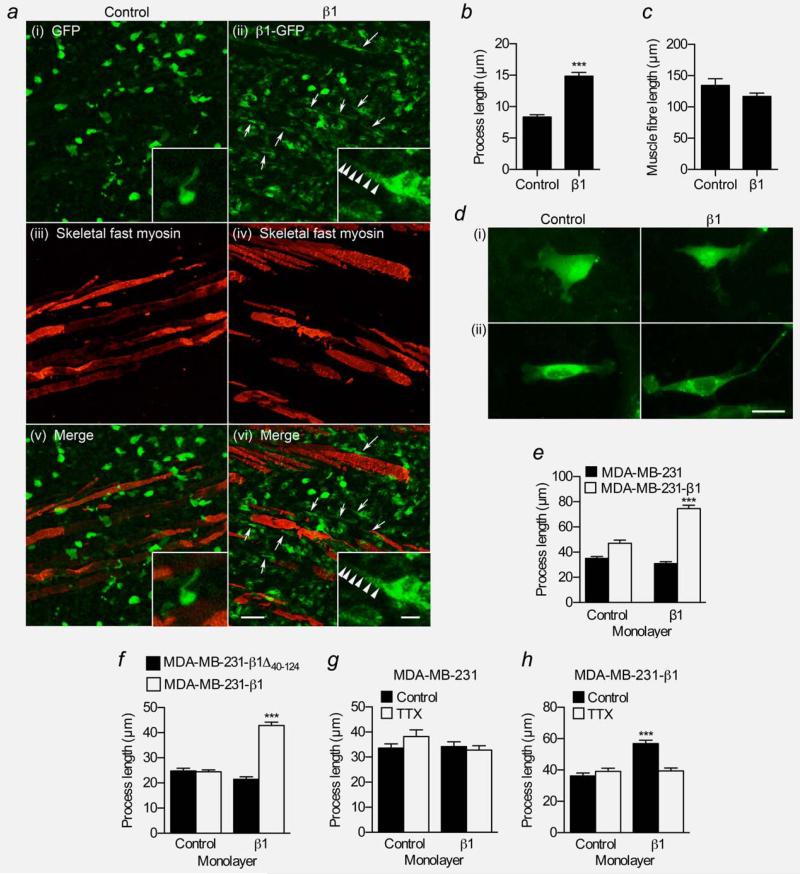
Figure 5. Effect of β1 on process outgrowth in breast cancer cells.
(a) Regions of skeletal muscle infiltration in control (i,iii,v) and β1 (ii,iv,vi) tumour sections showing GFP signal (green) and skeletal fast myosin (red). Arrows indicate cells in β1 tumours that have more elongate processes. Scale bar, 50 μm. Insets, higher magnification images of tumour cells showing processes. Inset scale bar, 10 μm. (β) Process length (μm) of control MDA-MB-231 and MDA-MB-231-β1 cells in tumours (n ≥134 cells/each). (c) Length (μm) of muscle fibers in control and β1 tumours (n ≥ 79). (d) Images of MDA-MB-231 and MDA-MB-231-β1 cells grown on control or β1-expressing CHL fibroblast monolayers, and stained with anti-GFP antibody. Scale bar, 20 μm. (e) Process length (μm) of MDA-MB-231 and MDA-MB-231-β1 cells grown on control or β1-expressing CHL monolayers (n = 300). (f) Process length (μm) of MDA-MB-231-β1D40–124 and MDA-MB-231-β1 cells grown on control or β1-expressing CHL monolayers (n = 300). (γ) Process length (μm) of MDA-MB-231 cells grown on control or β1-expressing CHL monolayers ± 30 μM TTX (n ≥144). (h) Process length (μm) of MDA-MB-231-β1 cells grown on control or β1-expressing CHL monolayers ± 30 μM TTX (n = 150). Bars are mean 1 SEM; ***p < 0.001.

