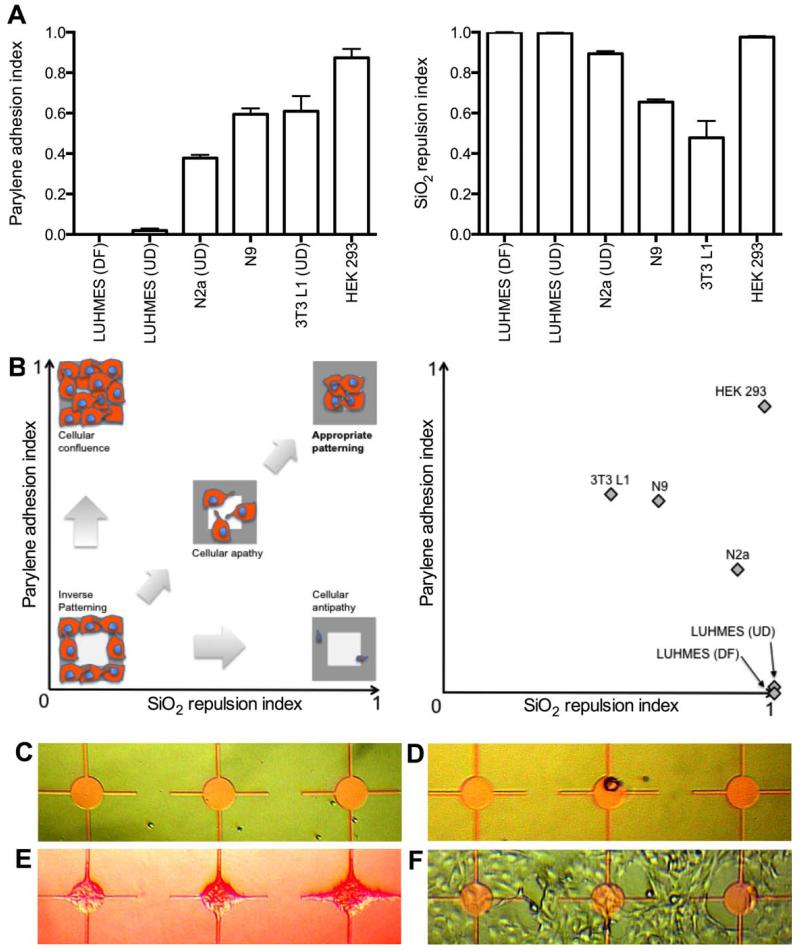
FIGURE 1.
A, Histograms of parylene adhesion index and silicon repulsion index for predifferentiated LUHMES (DF), un-differentiated LUHMES (UD), undifferentiated N2a (UD), N9, undifferentiated 3T3 L1 (UD), and HEK 293 cell lines. Mean ± SEM. B, Cartoon illustrating range of cell patterning behaviors (left) and corresponding plot of cell lines tested (right). C, predifferentiated LUHMES. D, undifferentiated LUHMES. E, HEK 293. F, undifferentiated 3T3 L1. All images taken at 3DIV. Node diameter 100 μm.

