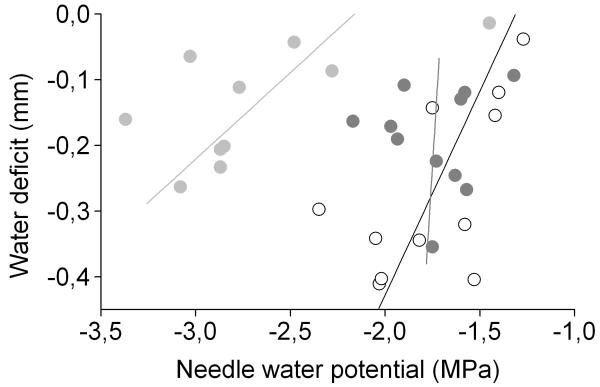
Fig. 3. Relationship between stem water deficit (ΔW) and minimum needle water potential (Ψea).
ΔW was determined at the same time of the day when Ψea were measured during the growing seasons 2011 and 2012. Species are denoted by solid line and open circle (P. abies), dark grey line and filled circle (P. sylvestris) and light grey line and filled circle (L. decidua)

