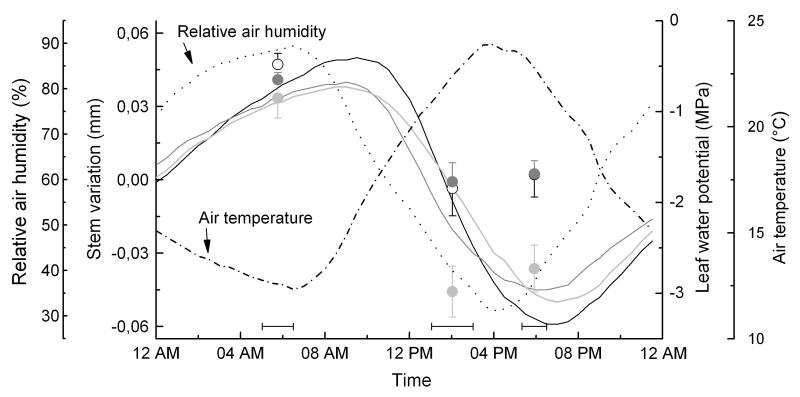
Fig. 5. Diurnal cycle of standardized stem radius variation (half-hourly records minus daily mean) and leaf water potential (Ψ, mean values ± standard deviation) compared to relative air humidity and air temperature.
Stem radius variations and climate variables were averaged from daily records when Ψ was determined. Species are denoted by solid line and open circle (P. abies), dark grey line and filled circle (P. sylvestris) and light grey line and filled circle (L. decidua). Horizontal bars indicate standard deviation with respect to measurements of Ψ

