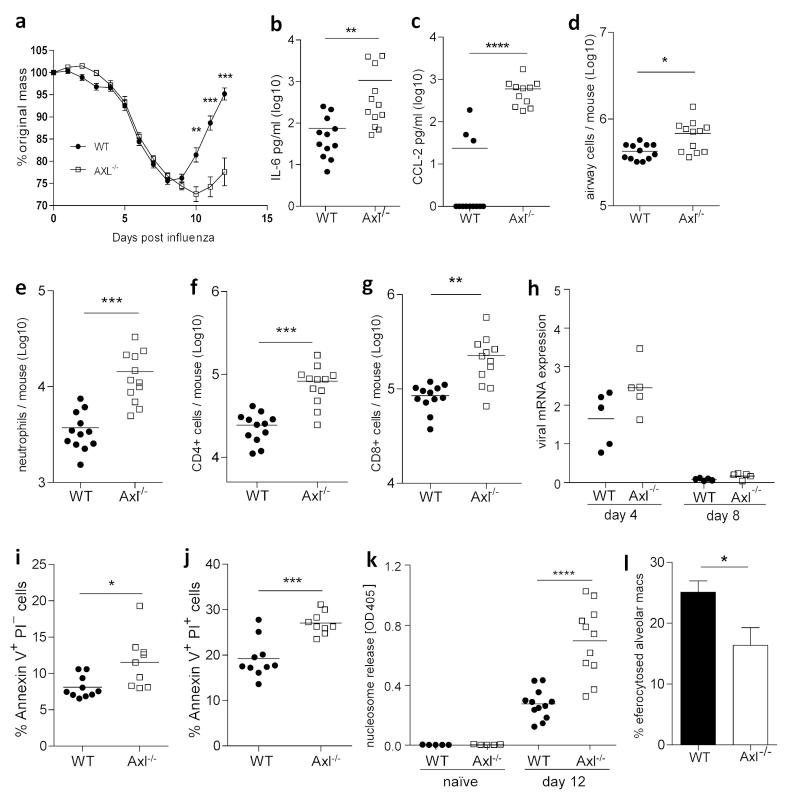
Figure 7.
Increased severity of viral lung disease in influenza-infected Axl−/− mice despite efficient clearance of viruses
(a) Change in body mass of wild type (WT) (closed symbol) and Axl−/− (open symbol) mice infected with 7.5pfu influenza. Amount of IL-6 (b) and CCL-2 (c) in the BAL fluid recovered on day 12 post influenza infection from WT and Axl−/− mice. (d) Analysis of viable cells in the BAL from WT and Axl−/− mice recovered on day 12 post influenza infection and counted using trypan blue exclusion. (e-g) Flow cytometric analysis of numbers of (e) neutrophils, (f) CD4+ T cells, and (g) CD8+ T cells in the BAL from WT and Axl−/− mice on day 12 post influenza infection. (h) Influenza genomic mRNA copies recovered from the total lung of WT and Axl−/− mice on days four and eight post influenza infection. (i,j) Flow cytometric analysis of percentage of (i) early (Annexin V+ propidium iodide (PI)−) and (j) late (Annexin V+PI+) apoptotic lymphocytes in the in the BAL from WT and Axl−/− mice on day 10 post influenza infection. (k) Amount of nucleosomes released in the BAL fluid recovered from WT and Axl−/− mice on day zero (naïve) and day 12 post influenza infection. (l) Efficiency of uptake of apoptotic thymocytes by WT (filled bar) and Axl−/− (open bar) airway macrophages measured by flow cytometry. (a-g,k) are representative of two or three independent experiments with 9-12 mice per group. (i,j) show data from one experiment with 10 mice per group. (h,l) are representative of two independent experiments with 4-5 mice per group. *P<0.05, **P<0.01, ***P<0.001, ****P<0.0001 versus corresponding group; unpaired t test.

