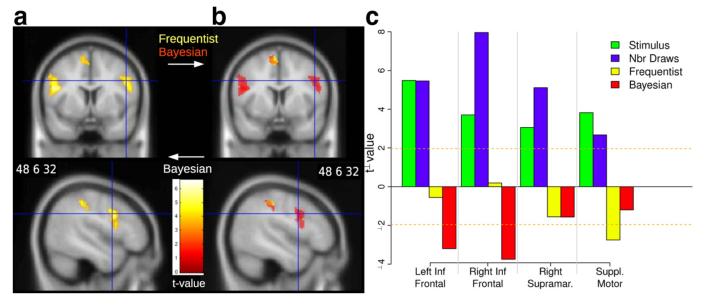
Figure 7.
Negative effects of probabilities in the sampling period (BOLD response to surprise measured by 1 minus the likelihood of the observed stimulus). a, Effect of Bayesian posterior probabilities in bilateral inferior frontal gyrus, right supramarginal gyrus, and medial supplementary motor area (GLM2). b, Effect of frequencies (yellow, GLM1) superimposed on the effect of Bayesian probabilities (red, GLM2). c, Effect of factual frequencies and Bayesian probabilities when entered simultaneously in the regression to explain BOLD response in each of the ROIs. Bayesian probabilities had a negative and significant effect in inferior frontal gyri. Factual frequencies had a negative and significant effect in supplementary motor area. The pattern was mixed in the supramarginal gyrus.

