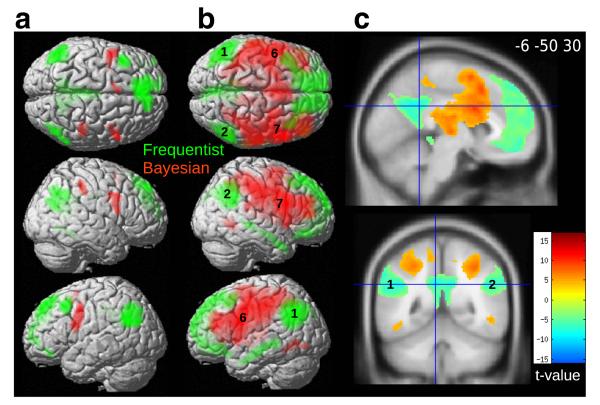
Figure 8.
Connectivity analysis in the sampling period. a, 3D rendering of the BOLD response to objective frequencies (green, GLM1) and Bayesian improbabilities (red, GLM2). b, In green are the voxels significantly related to activity in angular gyrus ROIs (1–2, encoding frequencies). The pattern of connectivity was characteristic of the default mode network with activation along the middle temporal gyrus. In red are the voxels significantly related to activity in inferior frontal gyrus ROIs (6 –7, encoding Bayesian improbabilities). Regions formed part of the attentional network. c, Cross-sectional view of the connectivity results (1–2, angular gyrus).

