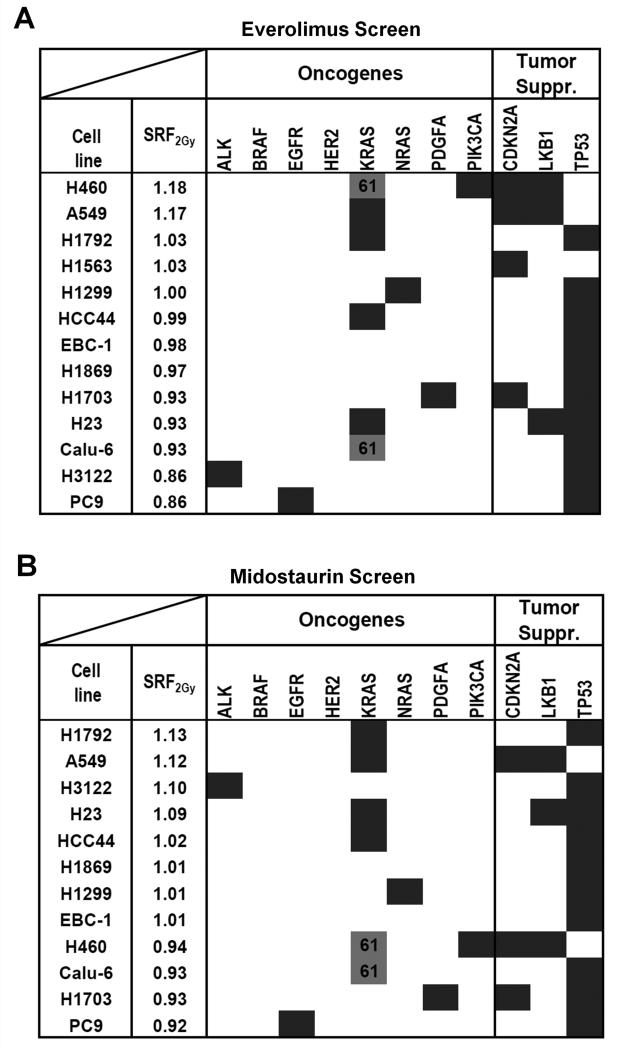
Figure 4.
Identification of genomic biomarkers of radiosensitization by the mTOR inhibitor everolimus and the multi-kinase inhibitor midostaurin. A) Results of IR/drug screen of 13 lung cancer cell lines with everolimus (20 nM) (Supplementary Table 1A). Cell lines are ranked by average SRF2Gy value. Dark fields indicate known mutations or other genomic alterations in common oncogenes and tumor suppressors (suppr.). KRAS codon 61 mutations (grey fill-in) are distinguished from codon 12/13 mutations (dark). SRF2Gy values are statistically significantly higher in p53 wild-type and than in mutated cell lines (p=0.001) (T-test). B) Analogous results for midostaurin (100 nM). SRF2Gy values are statistically significantly higher in cell lines with KRAS codon 12/13 mutations than in all other cell lines (p=0.01) and higher than in wild-type cell lines (p=0.04).

