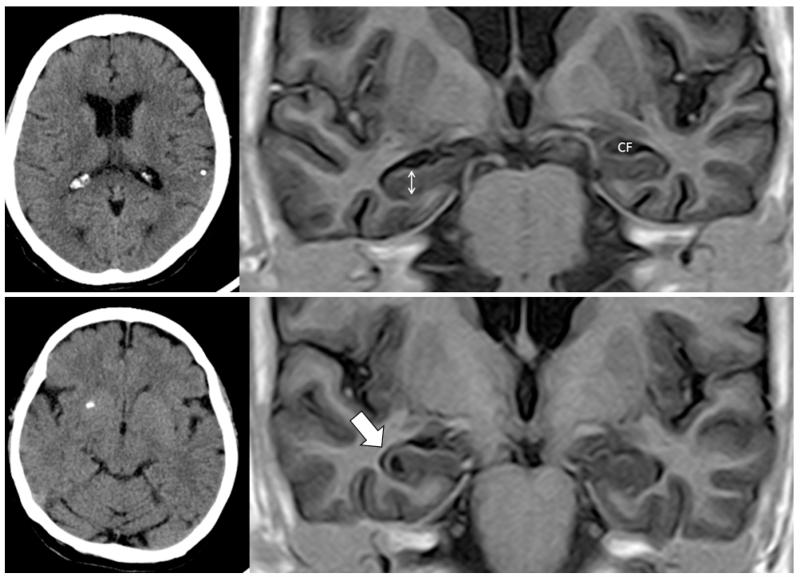
Figure 2.
Upper panel: Plain CT (left) showing single calcified cysticercus in left parietal lobe and T1-weighted inversion recovery MRI sequence (right) showing bilateral hippocampal atrophy (Grade 3 in the Scheltens’ medial temporal atrophy scale), characterized by increased width of the choroid fissure (CF) and decreased height of hippocampal formation (double-headed arrow). Lower panel: Plain CT (left) showing single calcified cysticercus in right basal ganglia and T1-weighted inversion recovery MRI sequence (right) showing ipsilateral hippocampal atrophy (thick arrow).

