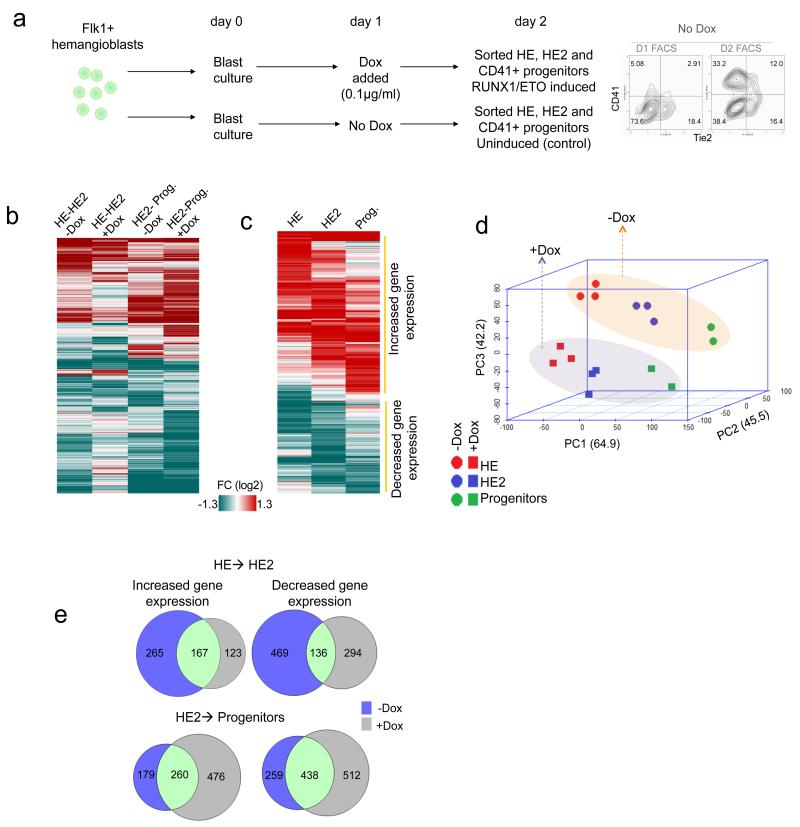
Figure 2. RUNX1-ETO induction alters the expression of different genes depending on the developmental stage.
(a) Schematic diagram of the FACS purification of HE, HE2 and CD41+ progenitors for microarray analysis. Right panel: surface marker profile of un-induced cultures at the indicated days. (b) Hierarchical clustering of the fold change of the differentially expressed genes through different stages of differentiation from HE to HE2 and HE2 to Progenitors before and after day 1 Dox induction. (c) Heatmap showing hierarchical clustering of the fold change of 2718 differentially expressed genes between the induced and the un-induced state after RUNX1-ETO induction. (d) Principal Component Analysis (PCA) of gene expression of un-induced and induced samples indicating that RUNX1-ETO differentially alters the expression profiles of genes at each stage. (e) Venn diagrams representing overlapping or distinct up- or down-regulated genes through differentiation, between HE and HE2 (top) and between HE2 and progenitors (bottom)

