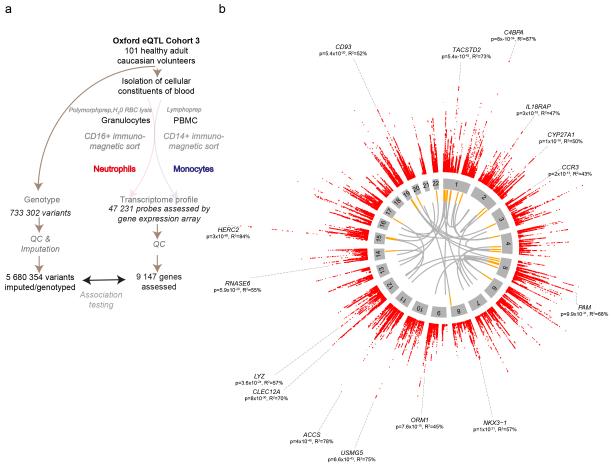
Figure 1. Study schema and overview of eQTL in primary human neutrophils.
(a) Flowchart showing the schema of this study to identify eQTL in human neutrophils from healthy adult volunteers of European ancestry with genotypes determined by array-genotyping and by imputation tested for association with global gene expression in cis (variant <1Mb of gene) or trans (variant on non-contiguous chromosome to gene). This analysis was contemporaneous to our previously reported study19 of monocytes enabling direct comparison of genetic correlates of gene expression between neutrophils and monocytes. (b) Circos plots for the neutrophil dataset. Outermost rim (red dots) shows a Manhattan plot for significant cis eQTL (FDR<0.05) with names of genes with large effect sizes (variance explained, R2>45%) or lowest five p-values; the second rim (grey boxes) shows the chromosome ideogram with chromosome number within each box; the third rim (orange boxes) indicates a gene to which a significant (FDR<0.01) trans-eQTL was observed; and the innermost spokes (grey) connect trans-acting variants to the gene the variant is associated with.

