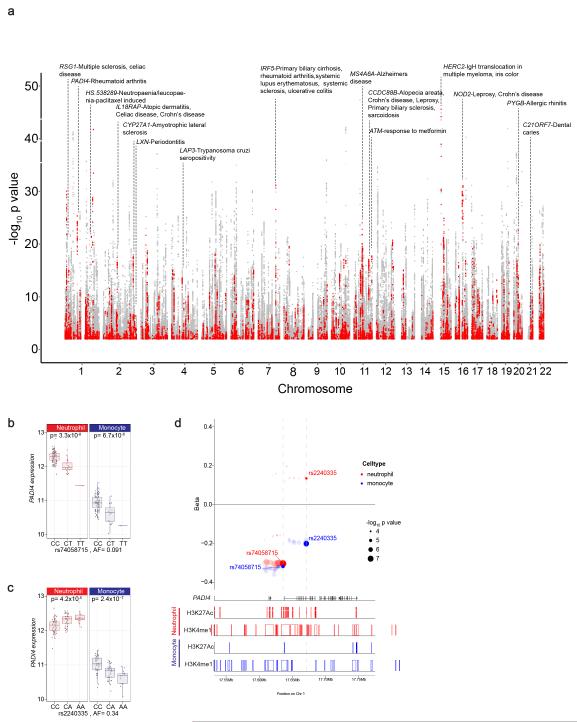
Figure 5. eQTL in neutrophils and their association with complex disease or trait.
(a) Manhattan plot showing eQTL in neutrophils highlighting those associated with or in linkage disequilibrium (r2>0.8) with a disease/trait associated variant listed in the NHGRI GWAS catalog. Each point denotes a single eQTL and is coloured red if the locus is associated with a complex trait or grey if not. (b-d) An example in PADI4 demonstrates how integrated analysis of an eQTL informs understanding of rheumatoid arthritis (RA) risk. Expression level of PADI4 is associated with two independent variants, (b) rs2240335 and (c) rs74058715 (r2=0.02). rs2240335-A, the derived allele, is associated with elevated expression of PADI4 in neutrophils and diminished levels in monocytes. rs7405871-T is associated with reduced PADI4 expression in neutrophils and monocytes. rs2240335 is in near complete linkage with rs2301888, and this locus is associated with RA risk54 (d) Compiled plot showing effect size estimate (beta) for variants associated with PADI4 expression in neutrophils and monocytes (upper panel), relative to genic structures (track two), and BLUEPRINT ChIP-Seq reads for two histone marks in neutrophils (tracks three and four) and monocytes (tracks 5 and 6) for H3K27Ac and H3K4me1 demonstrating that rs2240335 lies in a region marked by both H3K27Ac and H3K4me1, a marker of active enhancers, in neutrophils but not in monocytes.In panel B and D box lower and upper border denote 25th and 75th centiles respectively, central line denotes median and whiskers extend to 1.5*IQR. In all cases 101 donor replicates shown.

