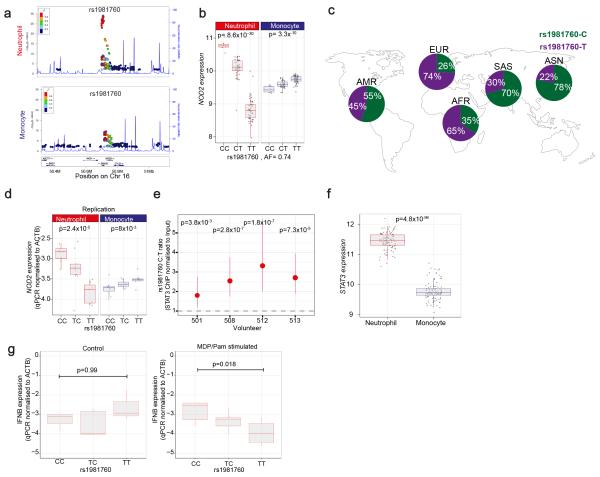
Figure 6. eQTL in NOD2 and their involvement in Leprosy and Crohn’s Disease(CD).
(a) Regional association plots for rs1981760 and NOD2 in Neutrophils (top) and monocytes (bottom). (b) The C (derived) allele at rs1981760, a variant located in an intergenic region between NOD2 and SNX20, is associated with elevated NOD2 expression in neutrophils and reduced NOD2 expression in monocytes, n=101. (c) rs1981760 is remarkable for the profound differentiation this allele appears to have undergone in Asian populations with the derived C allele predominating in Asians (data from the 1000 genomes project68). rs1981760 and rs9302752 are in high linkage disequilibrium (r2=0.98 in our cohort). rs9302752-C is associated with leprosy risk in GWAS reports from Chinese populations60. The C variant has a mild protective effect in CD independent of the deleterious 3020insC frameshift mutation in NOD259. (d) Quantitative PCR of NOD2 with two different primer sets performed blinded to genotype status in an independent set of 23 donors replicates the finding. Data representive of one primer-pair. (e) The rs1981760 SNP is located within a STAT3 transcription factor ChIP-seq binding site in MCF10A-Er-Src, an epithelial cell line (ENCODE). We investigated whether rs1981760 alters STAT3 binding in neutrophils by ChIP of STAT3 in four rs1981760 heterozygotes (screened to not have the 3020insC frameshift mutation in NOD2). Allele-specific probes in a digital droplet PCR assay demonstrate that the C allele is significantly more frequently immunoprecipitated with STAT3 than the T-allele. p values denote a chi-squared test comparing expected vs. actual ratio of positive and negative droplets for each donor. Tails show 95% CI of the enrichment estimate. (f) STAT3 expression levels differ between neutrophils and monocytes as measured by gene expression array, n=101. (g) After stimulation with muramyldipeptide(MDP), the ligand for NOD2 and Pam3CSK4 (a co-stimulant) neutrophils from rs1981760-CC homozygous individuals express significantly higher levels of IFNB mRNA than TT homozygotes, and heterozygotes express intermediate levels (left panel). No such association is apparent in mock-treated control neutrophils (right panel). In panels B, D, F and G, box lower and upper border denote 25th and 75th centiles respectively, central line denotes median and whiskers extend to 1.5*IQR.

