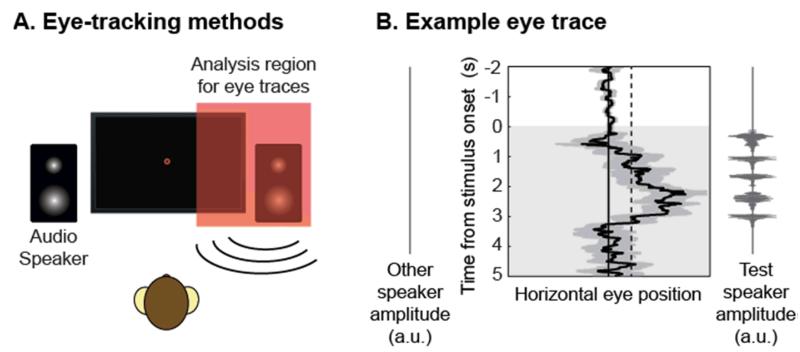
Figure 2. Details of macaque eye-tracking approach.
(A) Schematic of macaque eye-tracking experiment, adapted from Wilson et al. (2013). (B) Average eye trace (±SEM) from an example session in one monkey. Values to the right of the vertical midline represent eye movements toward the audio speaker (left or right) that presented test sequence. The 2SD baseline (based on the variance in eye movements during the 2 second baseline period) is shown as dotted line. The duration for which the eye position exceeded this threshold during the 5 second stimulus period (shaded area) was calculated.

