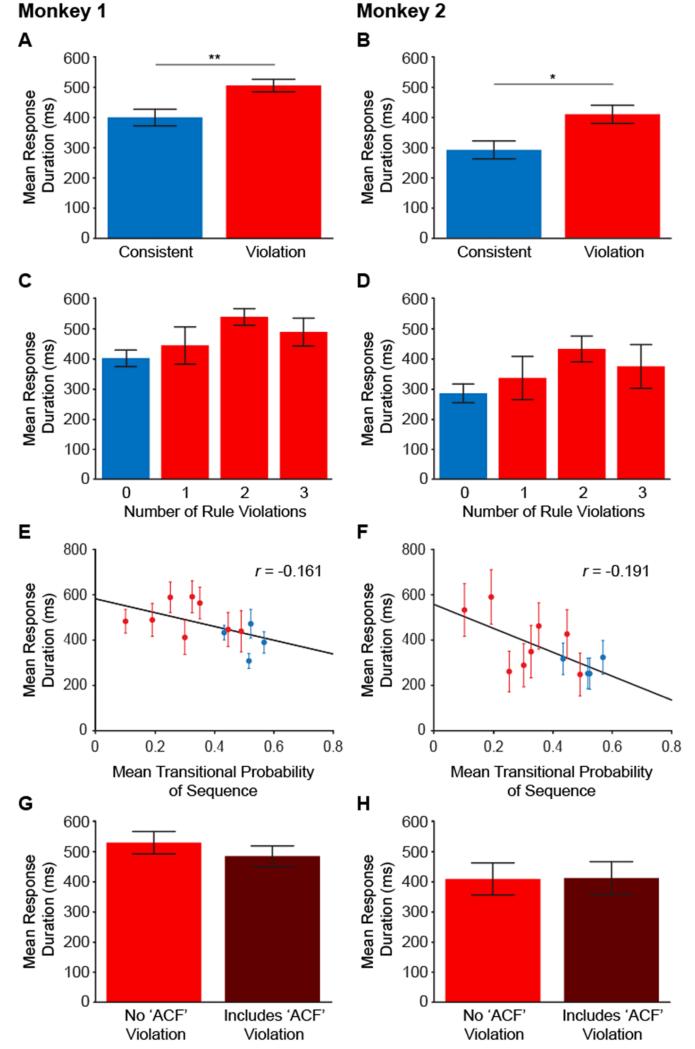
Figure 3. Monkey Experiment Results.
(A-B) Mean (and standard error of the mean, SEM) looking response duration towards the presenting audio speaker to consistent and violation testing sequences in both macaques. (C-D) Mean (±SEM) response duration, separated based on the number of rule violations in the consistent (blue) or violation (red) sequences. (E-F) Mean (±SEM) response duration plotted against the mean transitional probability of each consistent (blue) and violation (red) sequence. (G-H) Mean (±SEM) response duration to violation sequences that only contained local violations but not the long-distance, nonadjacent ‘ACF’ relationship (red). This contrasted to sequences that violate the long-distance ‘ACF’ association in addition to matched local violations (dark red). * = p < 0.05, ** = p < 0.01.

