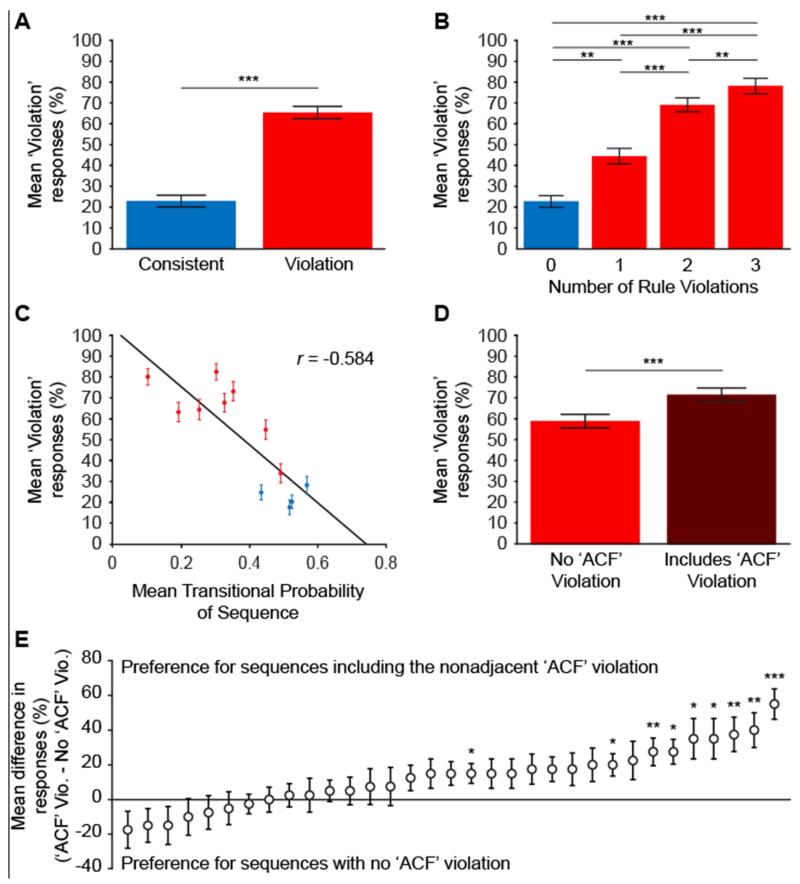
Figure 4. Human Experiment Results.
(A) Mean (±SEM) proportion of trials on which participants gave the “does not follow the pattern” (violation) response to the consistent and violation testing sequences. Values greater than 0.5 (chance level) represent accurate identification of the violation sequences (red) and values below 0.5 are accurate identification of the consistent sequences (blue). (B) Mean (±SEM) proportion of trials on which participants gave the ‘violation’ response separated based on the number of rule violations in the consistent (blue) or violation (red) sequences. (C) Mean (±SEM) proportion of trials on which participants gave the ‘violation’ response plotted against the mean transitional probability of each consistent (blue) and violation (red) sequence. (D) Mean (±SEM) proportion of trials on which participants gave the ‘violation’ response to violation sequences that only contained local violations, but not long-distance, nonadjacent ‘ACF’ violation (red), relative to those that also violated the long-distance ‘ACF’ association in addition to local violations (dark red). (E) Mean (±SEM) difference in proportion of trials on which individual participants (ranked by performance) gave the ‘violation’ response to sequences containing the ‘ACF’ violation relative to those with no ‘ACF’ violation. Values higher than zero represent accurate identification of the sequences containing the ‘ACF’ violation. A paired-samples sign test was performed for each participant, to identify those who responded to the nonadjacent ‘ACF’ violation significantly above chance. * = p < 0.05, ** = p < 0.01, *** = p < 0.001.

