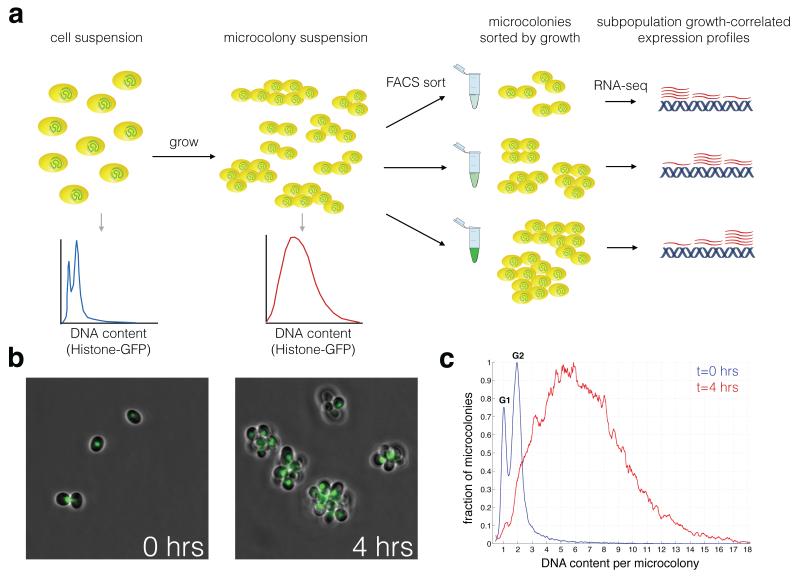
Figure 1. FitFlow: Sorting cells by single-cell fitness.
(a) FitFlow method: Single, chitinase deficient, Hta2-GFP expressing cells are suspended after brief sonication and G1 selection. Growth for several generations in liquid media results in microcolonies of cells that have a distribution of cell number. Flow cytometry of Hta2-GFP measurement reveals the micro-colony size distribution. Subsequent sorting on Hta2-GFP abundance thus separates populations according to their single-cell growth rate. RNA-seq analysis of each bin of growth rate reveals gene expression patterns associated with variable stochastic growth. (b) Microscopy at different time points shows microcolony formation. (c) Flow cytometry of single cells (t=0 hours) and microcolonies (t=4 hours) shows the distribution cell number per microcolony. The HTA2-GFP fusion enables high resolution measurement of DNA content as shown by separate G1 and G2 peaks at t=0 hours.

