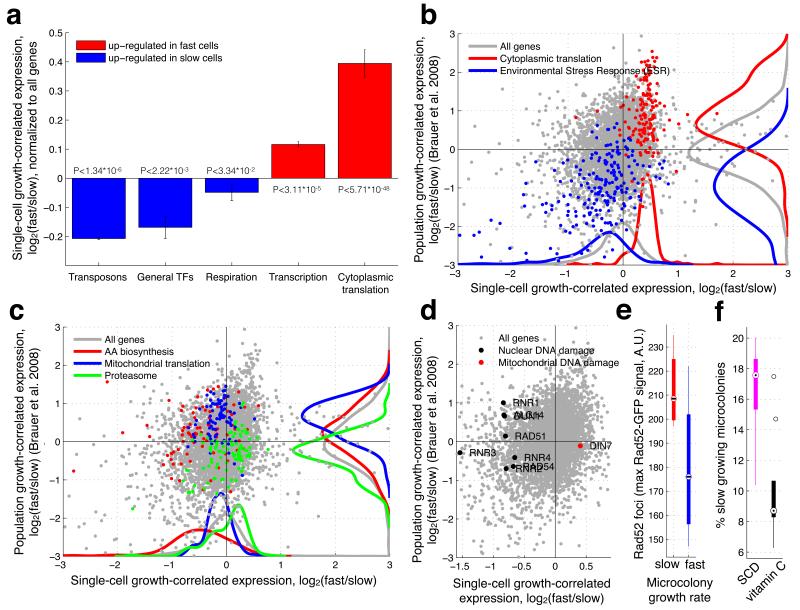
Figure 3. Transcriptional profiles of mean and subpopulation growth.
(a) Bar-plot showing mean and std expression of all genes in each functional group of genes up-regulated in the slow (blue) or fast (blue) growing subpopulations. (b-d) Growth-correlated expression from slow and fast growing subpopulations (FitFlow, X-axis) are compared to expression differences from growth rate varied in nutrient limited chemostats (Y-axis). (b) Scatter-plot the correlation of gene expression between subpopulation growth and mean population growth. Ribosomal genes (red) and stress genes (blue) are, respectively, up- and down-regulated both in subpopulation (X-axis, paired ks-tests pred=3.36*10−67 pblue=4.02*10−21) and mean population (Y-axis, paired ks-tests pred=2.45*10−36 pblue=8.26*10−50) fast growth. (c) Scatter-plot highlighting genes for which subpopulation growth is anti-correlated with mean population growth. Amino acid biosynthesis (red) and mitochondrial translation (blue) are down-regulated in the fast subpopulation (paired ks-tests pred=1.03*10−12 pblue=3.31*10−04) but up-regulated in mean population fast growth (paired ks-tests pred=3.30*10−04 pblue=2.64*10−16), while the proteasome (green) is up-regulated in the fast subpopulation (paired ks-test p=2.25*10−06) but down-regulated in mean population fast growth (paired ks-test p=4.69*10−07). (d) DNA damage genes (black points) are up-regulated in the slow subpopulation (X-axis, paired ks-test p=4.73*10−07), but are not correlated with average population growth rate differences (Y-axis, paired ks-test p=0.83). DIN7 (red point) is involved in mitochondrial DNA damage repair, and is the only DNA damage related gene that is not up-regulated in the slow subpopulation. (e) Time-lapse microscopy shows that cells from the slow growing subpopulation have Rad52-GFP foci. Foci were measured as the maximum Rad52-GFP signal in the nucleus (Y-axis) and growth (X-axis) as the microcolony growth rate where slow and fast cells represent the slowest 25% and fastest 75% respectively (t-test, p=0.02). (f) Addition of the antioxidant vitamin C reduced the fraction of slow growing microcolonies (t-test, p=0.005).

