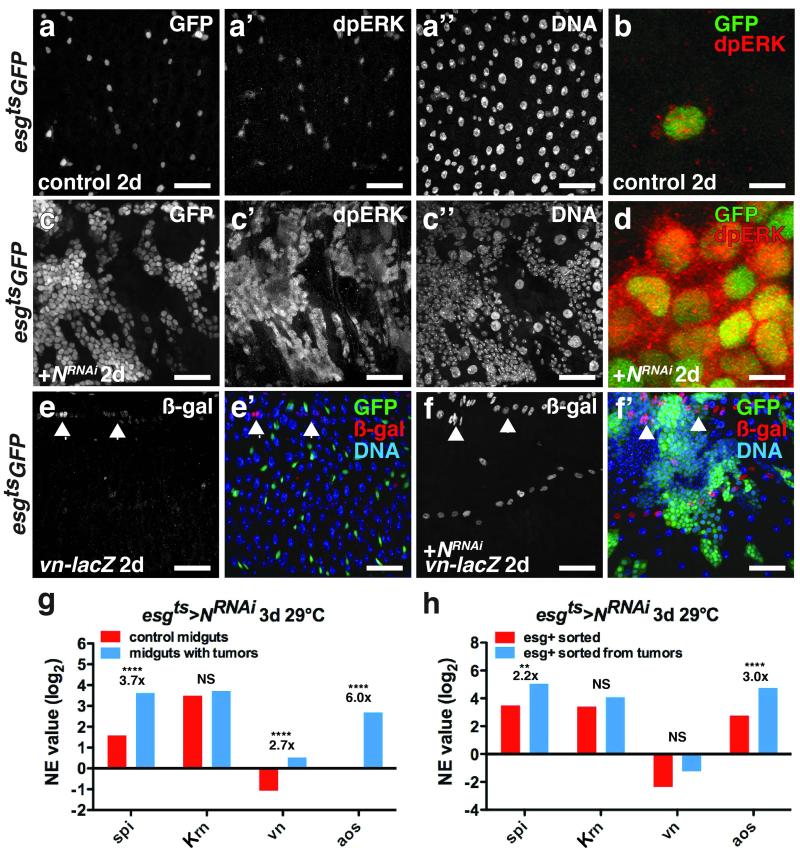
Figure 2. Spi/EGFR/MAPK signaling is induced in ISC tumors and the niche.
(a-d) Di-phosphorylated ERK (a’, c’; b, d, red) in midguts expressing GFP (a; b, green) or GFP and NRNAi (c; d, green) with esgts for 2 days.
(e-f) β-galactosidase (e,f; e’,f’, red) in midguts of flies bearing vn-lacZ (vnP1749) and expressing GFP (e’, green) or GFP and NRNAi (f’, green) with esgts for 2 days.
(g) Mean normalized expression (NE) value (RPKM, log2) from n=2 independent experiments of EGFR ligand (spi, Krn, vn) and signaling target (aos) mRNA determined by mRNA sequencing of midguts expressing GFP (control, red) or GFP and NRNAi (blue) with esgts for 3 days. The adjusted fold change in gene expression in tumorous midguts (blue), normalized to control midguts (red), is indicated. The Benjamini-Hochberg adjusted p-value for spi is 7.71e-322; vn, p= 3.25e-66; aos, p= 2.84e-264.
(h) Mean normalized expression (NE) value (RPKM, log2) from n=2 independent experiments of EGFR ligand (spi, Krn and vn) and signaling target (aos) mRNA determined by mRNA sequencing of esg+ cells sorted from control midguts expressing GFP (red) or from tumorous midguts expressing GFP and NRNAi (blue) with esgts for 3 days. The adjusted fold change in gene expression in sorted esg+ tumor cells (blue), normalized to esg+ cells from control midguts, is indicated. Benjamini-Hochberg corrected p-value for spi is 0.02924066; aos, 4.52e-05.
NS, not significant. DNA is in a’’ and c’’; e’ and f’ (blue). Scale bars in a-a’’, 35 μm; b, 10 μm; cc’’, 40 μm; d, 10 μm; e-e’, 35 μm and f-f’, 45 μm.

