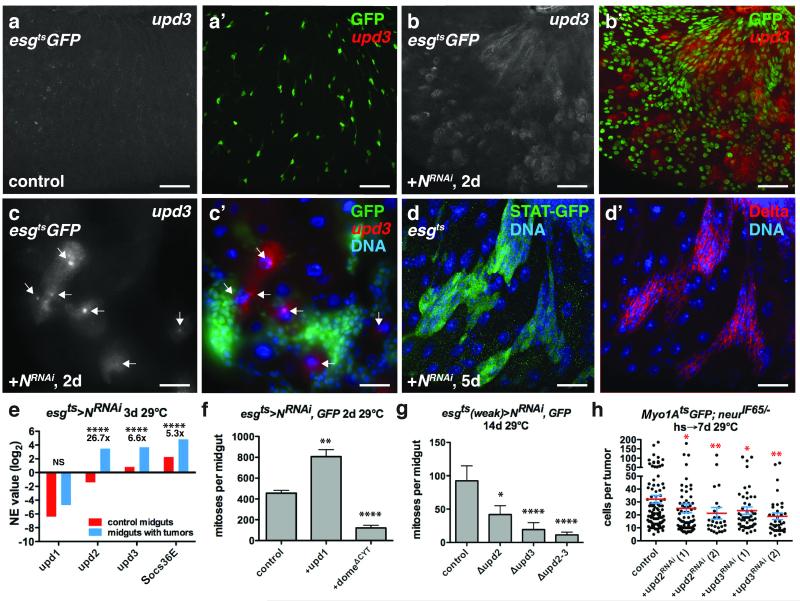
Figure 6. ISC tumors co-opt niche derived signals for their growth.
(a-c) Flourescent in situ hybridization to upd3 mRNA (a-c’; a’,b’,c’, red) in control midguts expressing GFP (a’, green) or GFP and NRNAi (b’, c’, green) with esgts for 2 days. ECs near ISC tumors expressed upd3 (c-c’, arrows).
(d) D-GFP (d, green) and Delta (d’, red) in midguts of flies bearing 10X-STAT-D-GFP and expressing NRNAi with esgts (without UAS-GFP) for 5 days.
(e) Mean normalized expression (NE) value (RPKM, log2) from n=2 independent experiments of cytokine (upd1-3) and JAK-STAT target (Socs36) mRNA determined by mRNA sequencing of whole midguts expressing GFP (control, red) and GFP and NRNAi (blue) with esgts for 3 days. The adjusted fold change in gene expression in midguts bearing tumors (blue), normalized to control midguts (red), is indicated. The Benjamini-Hochberg adjusted p-value for upd2, upd3 and Soc36E is 7.71e-322. NS, not significant.
(f) Mean number of phosphorylated histone H3 Ser10 positive cells per midgut after expression of NRNAi (n=48 midguts), Upd1 and NRNAi (n=45 midguts, p=0.0011), and NRNAi and domeΔCYT (n=39 midguts, p<0.0001) with esgts for 2 days.
(g) Mean number of phosphorylated histone H3 Ser10 positive cells per midgut after expression of NRNAi with esgts (weak) for 14 days in control flies (n=27 midguts) and flies mutant for upd2 (upd2Δ, n=25 midguts, p=0.0176), upd3 (upd3Δ, n=34 midguts, p<0.0001) and upd2 and upd3 (upd2-3Δ, n=28 midguts, p<0.0001).
(h) Cells per neurIF65/− tumor amongst ECs expressing GFP (control, n=101 tumors from 38 midguts, skewness= 2.097, kurtosis= 4.754) or RNAis against upd2(1) (n = 41 tumors from 35 midguts, p=0.0181, skewness= 3.681, kurtosis= 15.980) and upd2(2) (n=27 tumors from 23 midguts, p=0.0033, skewness= 3.068, kurtosis= 10.720) and upd3(1) (n=55 tumors from 36 midguts, p=0.0233, skewness= 2.742, kurtosis= 8.061 and upd3(2) (n=37 tumors in 25 midguts, p=0.0010) with Myo1Ats for 7 days.
In f-h, midguts were pooled from 3 independent experiments; p-values from Mann-Whitney test; mean with s.e.m. are shown. Scale bars in a-b’, 40 μm; in c-c’, 30 μm; in d-d’, 25 μm. DNA in c’, d-d’ (blue).

