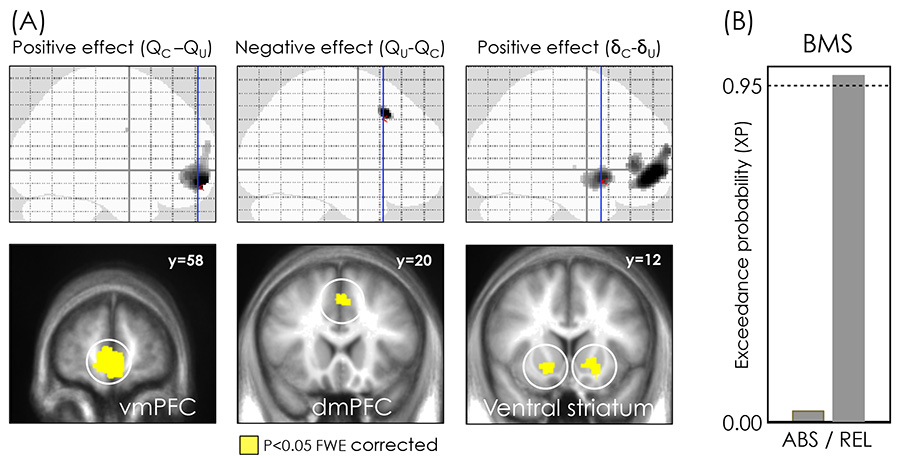
Figure 5. neural model comparison.
Brain areas correlating positively and negatively with the difference between chosen and unchosen option value (QC-QU; left and central column), and correlating positively with the difference between chosen and unchosen prediction error (δC -δU; right column). Significant voxels are displayed on the glass brains (top) and superimposed to slices of the between-subjects averaged anatomical T1 (bottom). Coronal slices correspond to the blue lines on sagittal glass brains. Areas colored in gray-to-black gradient on glass brains and in yellow on slices showed a significant effect (P<0.05, voxel level FWE corrected). Y coordinates are given in the MNI space. The results are from the GLM using the ABSOLUTE model parametric modulators (GLM1a). (B) Bayesian model comparison (BMS) of GLMs regressing ABSOLUTE (ABS) and RELATIVE (REL) option values and prediction errors (GLM1a and GLM1b). BMS is performed within the functional ROIs, presented on the left in yellow on the brain slices. Note that ROI selection avoids double dipping in favour of the hypothesis we aimed to validate, since the ROIs were defined from GLM1a (ABS) and GLM1a (ABS) was the hypothesis we aimed to reject.

