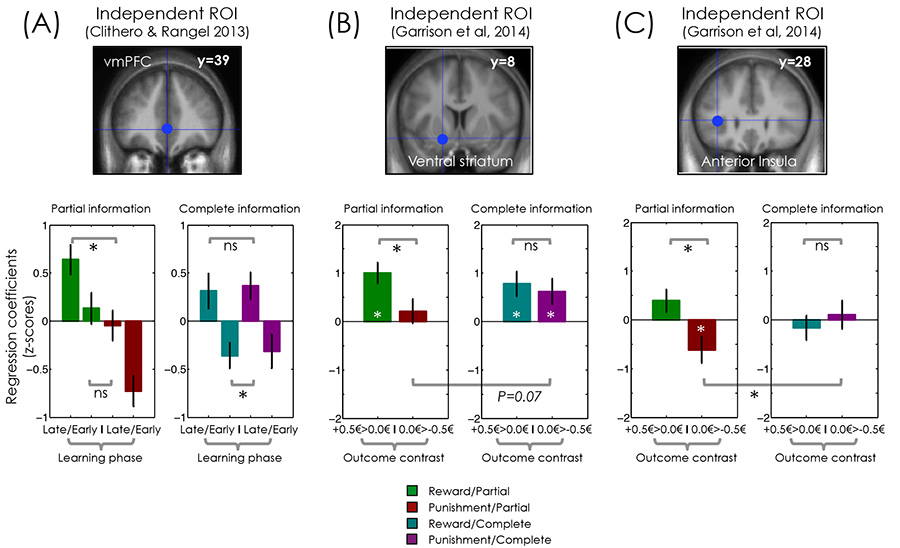
Figure 6. model-free neural evidence of value contextualization.
(A) Bars represent the regression coefficients extracted in the ventromedial prefrontal cortex, as a function of the task contexts (represented by different colors) and leaning phase (early: first eight trials; late: last eight trials). Regression coefficients are extracted from the model-free GLM2 within a sphere centered on literature-based coordinates of the ventromedial prefrontal cortex11. (B) & (C) Bars represent the regression coefficients for best>worst outcome contrast as a function of the task contexts. (“+0.5€>0.0€”: best>worst outcome contrast in the reward contexts; “0.0€>−0.5€”: best>worst outcome contrast in the punishment contexts). Regression coefficients are extracted from the model-free GLM3 within spheres centered on literature-based coordinates of the striatum and anterior insula8. Y coordinates are given in the MNI space. Note that ROI selection avoids double dipping, since the ROIs were defined from independent studies (metanalyses). *P<0.05 one sample t-test comparing between regressors (black ‘*’) or to zero (white ‘*’) (N=28); ns: not significant. Error bars represent s.e.m.

