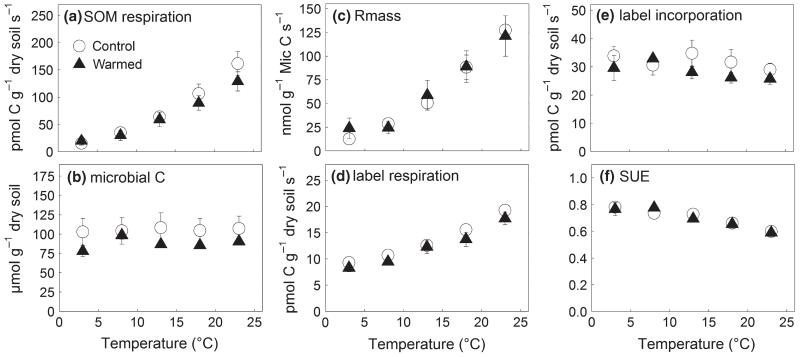
Fig. 5.
Effects of soil temperature on decomposer efficiency. Heterotrophic respiration of SOM, corrected for 13C respiration (a); microbial biomass C (b); mass-specific respiration (c); respired 13C label (d); 13C label incorporated into microbial biomass (e); and substrate use efficiency (SUE, f). Full triangles represent the values from long-term warmed soil (means ± SE, n = 3). Open circles represent the values of soil which had experienced the corresponding natural temperature conditions (means ± SE, n = 3). Mineral soil from each subplot was incubated simultaneously at the indicated soil temperatures for 24 h.

