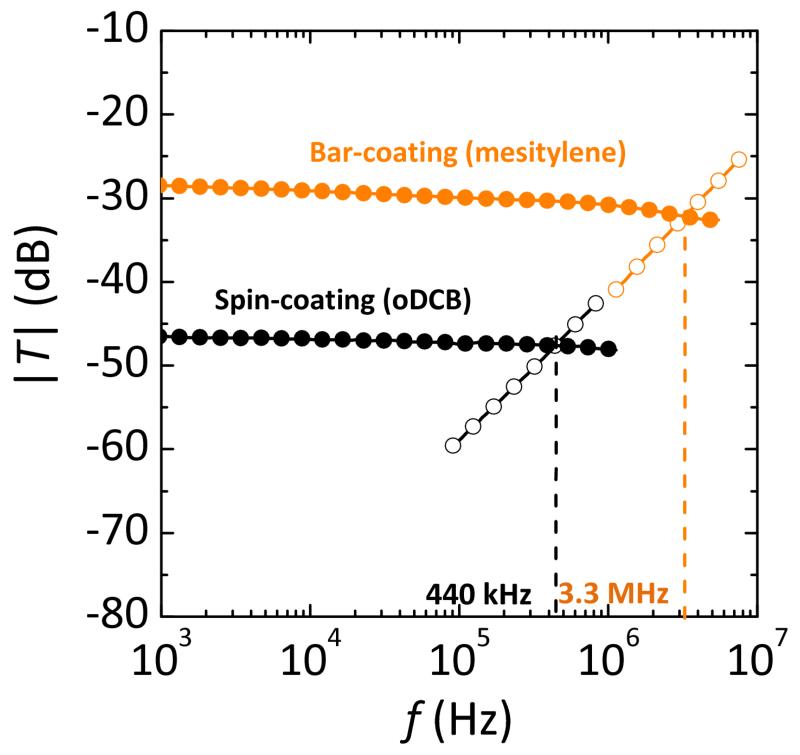
Figure 6. Frequency of transition of FETs.
Frequency characterization of devices made by a standard spin-coating of a 5 gl−1 solution of P(NDI2OD-T2) in oDCB (black symbols) and a bar-coating of a 5 gl−1 solution of the same polymer in mesitylene (orange symbols). The input/output ac voltage transfer function has two contributions: the channel signal (filled symbols), which depends on the transconductance of the FET and the gate capacitance signal (open symbols), owing to the capacitive current that flows through the gate. The intersection between the two contributions results in the transition frequency ft, above which the capacitive coupling dominates over the channel contribution. The devices have W = 200 μm and L = 5 μm.

