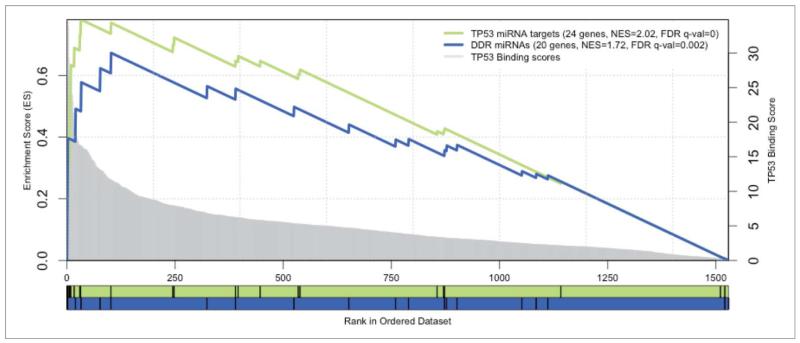
Figure 8.
Enrichment plots of microRNA signatures in all miRNAs ranked by TP53 motifs. GSEA pre-ranked results for 2 gene sets (signatures) scored for enrichment of TP53 binding sites: the DDR miRNAs (in blue) and the TP53 annotated targets as a positive control set (in green). The X-axis represents all known miRNA genes ranked by the score of TP53 motifs in their regulatory region. Genes with best scores are toward the left. The score distribution is represented by the gray chart in the background, with corresponding y-axis in the right. The black vertical bars correspond to the ranking of the miRNAs of the given signature. The curves display the running enrichment score (ES) for the gene set as the analysis walks down the ranked list. The score at the peak of the plot (the score furthest from 0.0) defines the ES for the gene set. For each tested set, the number of miRNAs, the normalized enrichment score (NES) and the FDR q-value are indicated in the legend.

