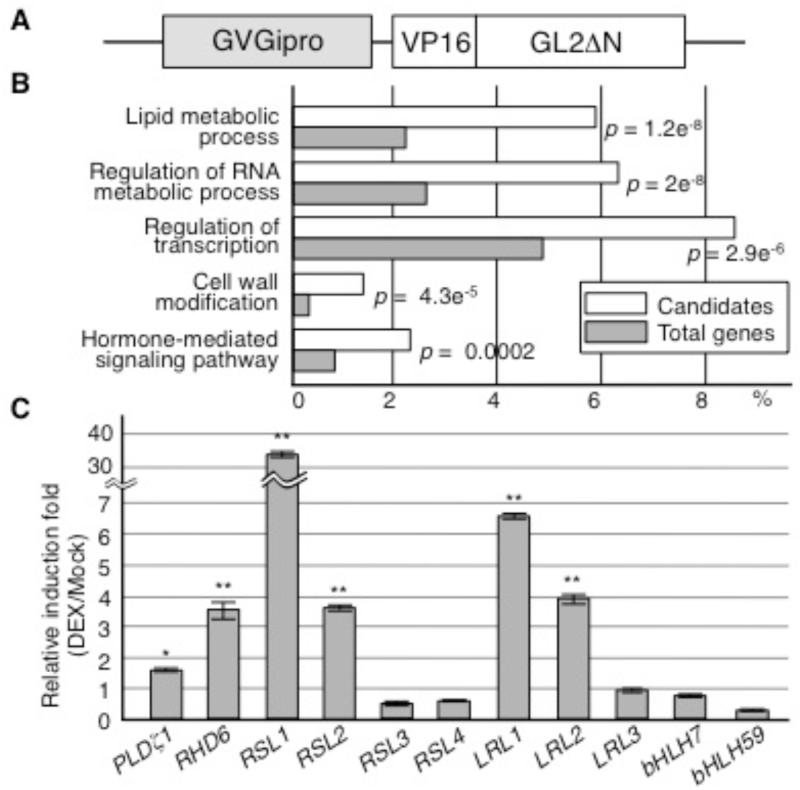
Figure 1.
Microarray and Individual Expression Analyses for Candidate GL2 Target Genes.
(A) The structure of the modified GL2 gene (GVGipro-VP16-GL2ΔN) used in the expression analyses for candidate GL2 target genes is schematically illustrated. The promoter is glucocorticoid-inducible via the function of the GVG transcription factor.
(B) The candidate target genes obtained from the microarray analysis were categorized by gene product functions as defined using the agriGO web-based software tool (Du et al., 2010), and the top five groups with most significant enrichment are shown with the ratios of their populations in the candidates (white box) and the total Arabidopsis genes (gray box). p-values are indicated on the right of boxes.
(C) Relative induction folds (DEX/Mock) of transcript levels in the expression analysis for individual bHLH VIIIc and XI subfamily genes, and the PLDζ1 gene as a positive control, are shown (mean ± s.d., n =3). Asterisks indicate significant differences between the levels of the DEX and Mock samples (* P < 0.05, ** P < 0.01, Student’s t-test).

